We provide graphs and tables comparing performance with and without injection on our four TSPs.
Comparison of average performance of RGA and NRGA when injecting individuals from the same problem. Figures 14, 15, 16, and 17 compare performance with a randomly initialized GA.
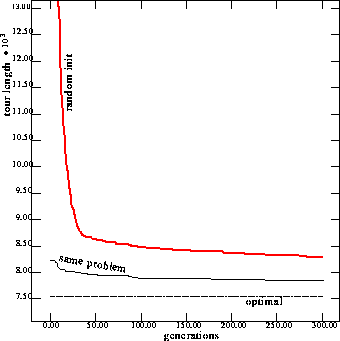
Figure: 52 cities problem. Optimal tour length is 7542, the NRGA tour length
is 7849.4, and the RGA tour length is 8290.4
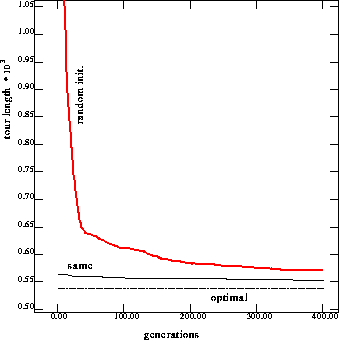
Figure: 76 cities problem. Optimal tour length is 538, the NRGA tour length
is 552.8, and the RGA tour length is 571.2
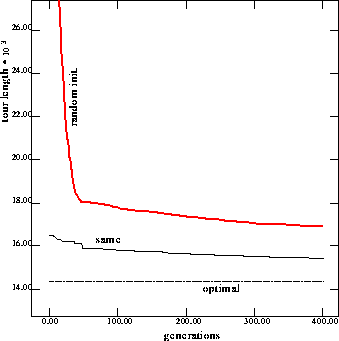
Figure: 105 cities problem. Optimal tour length is 14379, the NRGA tour length
is 15424.2, and the RGA tour length is 16946
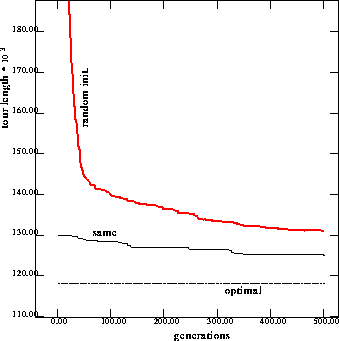
Figure: 127 cities problem. Optimal tour length is 118282, the NRGA tour
length is 125136, and the RGA tour length is 131052
Comparison of average performance of RGA and NRGA when injecting individuals from the diff1 problem. Figures 18, 19, 20, and 21 compare performance with a randomly initialized GA.
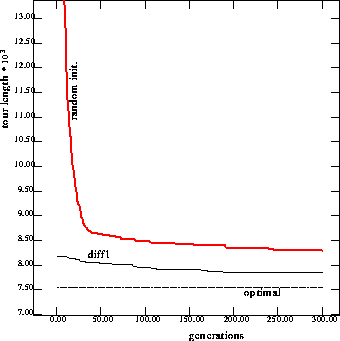
Figure: 52 cities problem. Optimal tour length is 7542, the NRGA tour length
is 7856.4, and the RGA tour length is 8290.4
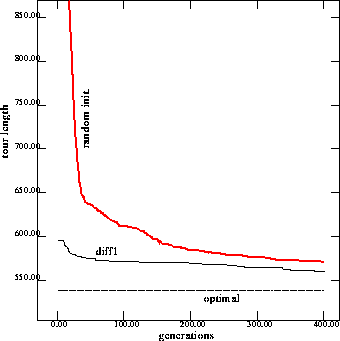
Figure: 76 cities problem. Optimal tour length is 538, the NRGA tour length
is 560.3, and the RGA tour length is 571.2
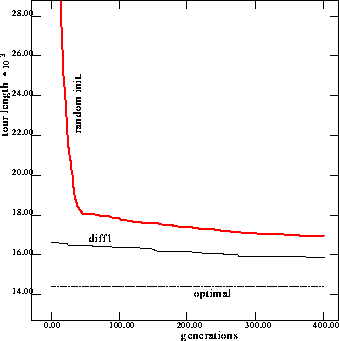
Figure: 105 cities problem. Optimal tour length is 14379, the NRGA tour length
is 15862.1, and the RGA tour length is 16946
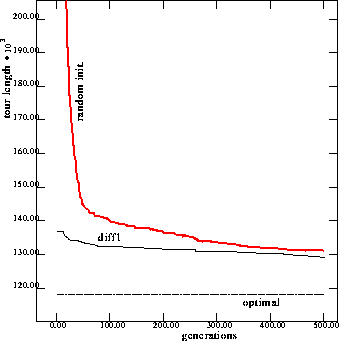
Figure: 127 cities problem. Optimal tour length is 118282, the NRGA tour
length is 129164, and the RGA tour length is 131052
Comparison of average performance of RGA and NRGA when injecting individuals from the diff2 problem. Figures 22, 23, 24, and 25 compare performance with a randomly initialized GA.
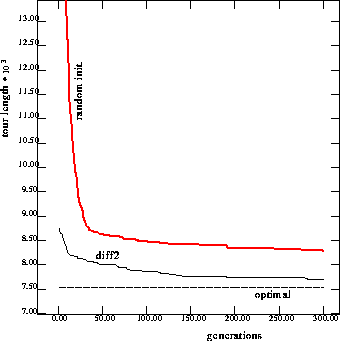
Figure: 52 cities problem. Optimal tour length is 7542, the NRGA tour length
is 7717.1, and the RGA tour length is 8290.4
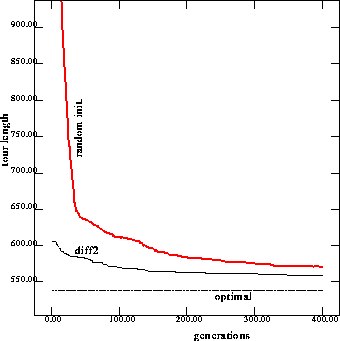
Figure: 76 cities problem. Optimal tour length is 538, the NRGA tour length
is 559.8, and the RGA tour length is 571.2

Figure: 105 cities problem. Optimal tour length is 14379, the NRGA tour length
is 15442.3, and the RGA tour length is 16946
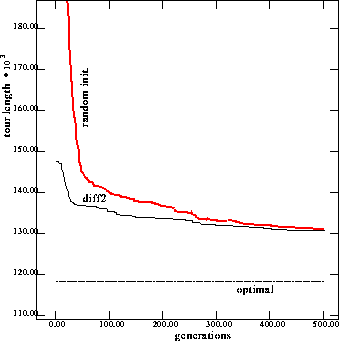
Figure: 127 cities problem. Optimal tour length is 118282, the NRGA tour length
is 130610, and the RGA tour length is 131052
Comparison of average performance of RGA and NRGA when injecting individuals from the add1 problem. Figures 26, 27, 28, and 29 compare performance with a randomly initialized GA.
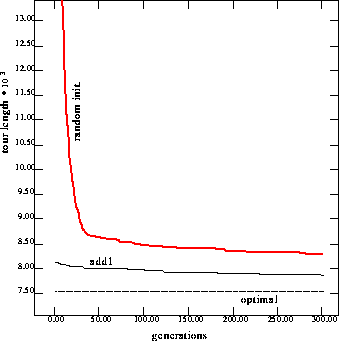
Figure: 52 cities problem. Optimal tour length is 7542, the NRGA tour length
is 7849.4, and the RGA tour length is 8290.4
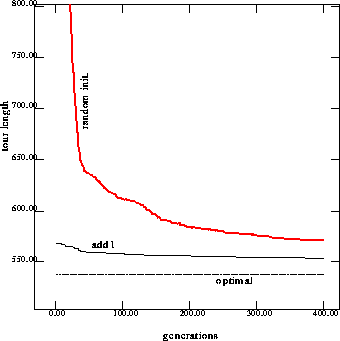
Figure: 76 cities problem. Optimal tour length is 538, the NRGA tour length
is 553.5, and the RGA tour length is 571.2
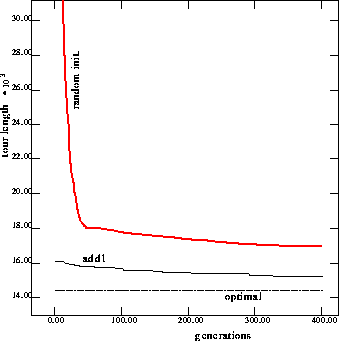
Figure: 105 cities problem. Optimal tour length is 14379, the NRGA tour length
is 15424.3, and the RGA tour length is 16946
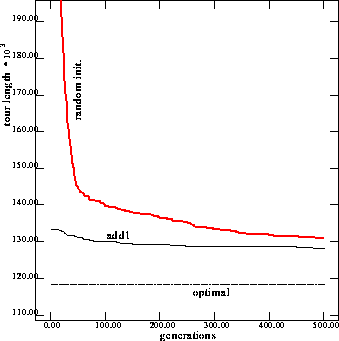
Figure: 127 cities problem. Optimal tour length is 118282, the NRGA tour length
is 128226, and the RGA tour length is 131052
Comparison of average performance of RGA and NRGA when injecting individuals from the del1 problem. Figures 30, 31, 32, and 33 compare performance with a randomly initialized GA.
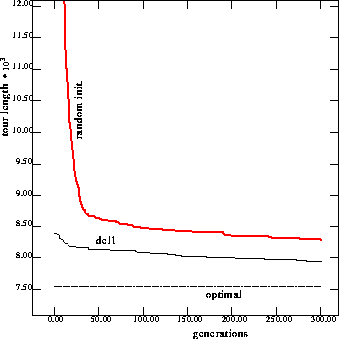
Figure: 52 cities problem. Optimal tour length is 7542, the NRGA tour length
is 7948.9, and the RGA tour length is 8290.4
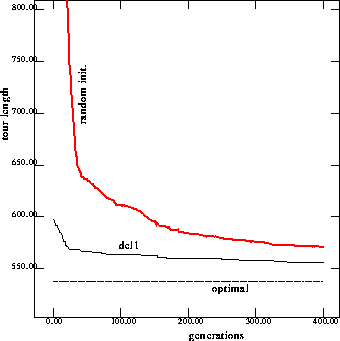
Figure: 76 cities problem. Optimal tour length is 538, the NRGA tour length
is 555.8, and the RGA tour length is 571.2
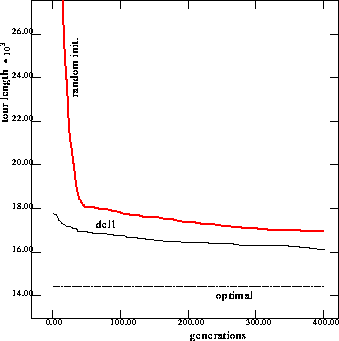
Figure: 105 cities problem. Optimal tour length is 14379, the NRGA tour length
is 16107.8, and the RGA tour length is 16946
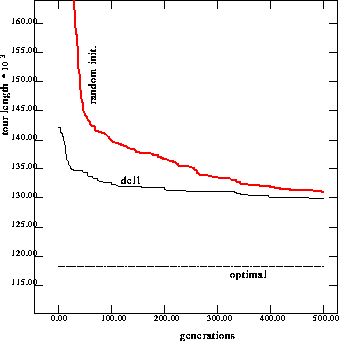
Figure: 127 cities problem. Optimal tour length is 118282, the NRGA tour
length is 129943, and the RGA tour length is 131052
Comparison of the first generation and last generation tour length of RGA and NRGAs. Column one of the tables shows the modified problem while column two and three show the percentage distance of the first and the last generation tour length from the optimal tour length. Table 7.6, 7.6, 7.6, and 7.6 compare performance on the 52, 76, 105 and 127 cities problems respectively.
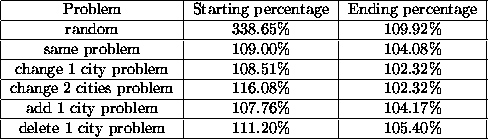
Table 4: Performance comparison for the 52 cities problem
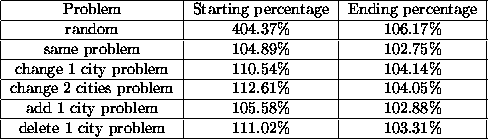
Table 5: Performance comparison for the 76 cities problem
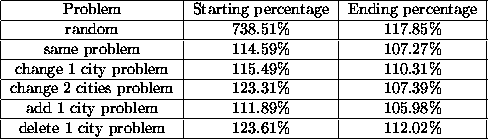
Table 6: Performance comparison for the 105 cities problem
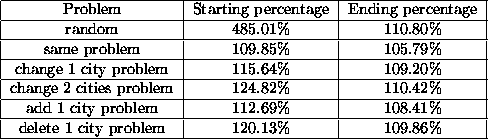
Table 7: Performance comparison for the 127 cities problem