


Next: Analysis
Up: Results and Analysis
Previous: Results and Analysis
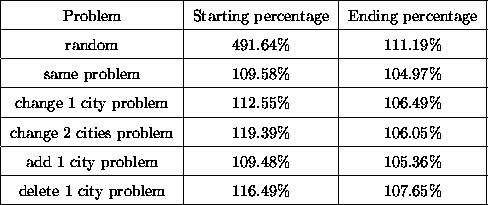
Table 3: Average distance from optimal for all problems
Table 5.1 shows the average performance of different sized problems for
running the NRGA with different modified problems. Column one shows
the modified problem, while column two and three show the percentage
distance of the first and the last generation tour length from the optimal
tour length. From this table, we can see that after injecting
individuals and running GAs with previous information, we can always
get better results than when running GAs with random initialization on our
problems. We provide details on each modified problem below:
-
Same problem (same).
We do not change the problem letting  be the original problem
and solving the original problem twice. The first time we run the RGA
10 times with 10 random seeds, while the second time we run the NRGA
10 times with injection from the RGA solutions. Figure 7
shows the optimal solution, the average performance from running the RGA
10 times and the average performance from running the NRGA 10 times
for the 76 cities TSP. The performances from the other problems
are shown in Appendix A. As expected, injecting solutions from the same
problem can help NRGAs get better performance especially in early
generations.
be the original problem
and solving the original problem twice. The first time we run the RGA
10 times with 10 random seeds, while the second time we run the NRGA
10 times with injection from the RGA solutions. Figure 7
shows the optimal solution, the average performance from running the RGA
10 times and the average performance from running the NRGA 10 times
for the 76 cities TSP. The performances from the other problems
are shown in Appendix A. As expected, injecting solutions from the same
problem can help NRGAs get better performance especially in early
generations.
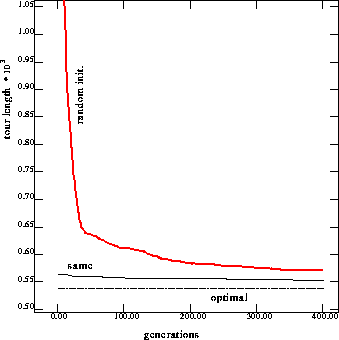
Figure 7: Performance on 76 cities problem with injection from solutions
to the same problem
-
Change one city (diff1).
We slightly change the original problem by randomly selecting one city and
changing its location by randomly changing its x and y coordinates by  to
to
 . Note that the problem size remains the same.
Figure 8 compares the average performances on the 76 cities TSP and
Appendix A also shows the performances from other problems. Now, since
and the original problem are different, the performance during
early generations is not as good as the performance when injecting solutions
from the same problem
but the performance is still better than with random initialization.
. Note that the problem size remains the same.
Figure 8 compares the average performances on the 76 cities TSP and
Appendix A also shows the performances from other problems. Now, since
and the original problem are different, the performance during
early generations is not as good as the performance when injecting solutions
from the same problem
but the performance is still better than with random initialization.
Figure 8: Performance on 76 cities problem with injection from solutions
to the changing one city problem
-
Change two cities (diff2).
We randomly select two cities and change their locations by randomly changing
their x and y coordinates by to . The average performance from the 76 cities TSP is shown in
Figure 9 while the performances from other problems are shown in
Appendix A.
The graph shows that the performance is still better than that of an RGA.
When changing two cities instead of changing one, the two problems are less
similar which leads to the difference in performance between diff1 and
diff2.
During earlier generations, the performance of diff1 is always better than that of diff2. However, during later generations, this is not
always true and diff2 actually results in better performance on some of
our benchmarks.
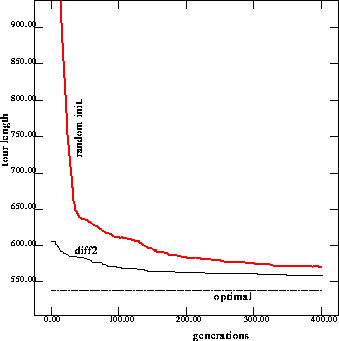
Figure 9: Performance on 76 cities problem with injection of solutions to
the changing two cities problem
-
Add one city (add1).
To modify the original problem, we not only change the location of
cities, we also change the size of the problems. We do this by adding
or deleting one city. When adding one city, we generate a new city and
let its coordinates be between the maximal and minimal
coordinates of all cities. We run the RGA to solve the modified problem
and save the best individuals. For each of these individuals, we
delete the added city so the changed individuals are legal tours for
the original problem. Then we inject these changed individuals to
solve the original problem. After comparing the average performance
on the 76 cities problem (as shown in Figure 10), we can see
that adding one city can help GAs get performance similar to that
obtained when injecting solutions from the same problem. The
performances on the other benchmarks are shown in Appendix A.
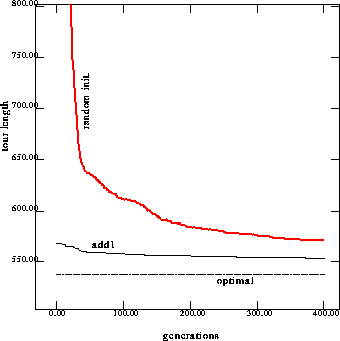
Figure 10: Performance on 76 cities problem with injection from solutions to the
adding one city problem
-
Delete one city (del1).
We also randomly delete one city, run GAs to solve the modified problem and
save the best
individuals. For each one of these individuals, we randomly select one site
and insert the deleted city, so that the changed individuals become legal tours
for the original problem. We then inject these new individuals to solve the original problem.
Figure 11 compares the average performances on the 76 cities problem.
The performances from the other problems are shown in Appendix A. Because we
randomly insert the deleted city, the performance during the first few generations is not as good as when injecting solutions from other similar
problems but the performance is still better than an RGA.
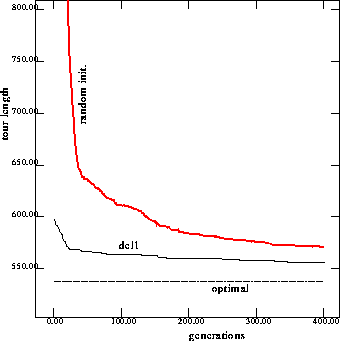
Figure 11: Performance on 76 cities problem with injection from
solutions to the deleting one city problem
Figure 12 and Figure 13 show the optimal solution [Reinelt 96] and our best
solution by running the NRGA on the 76 cities TSP.
The edges are not all the same, but the lengths are very close
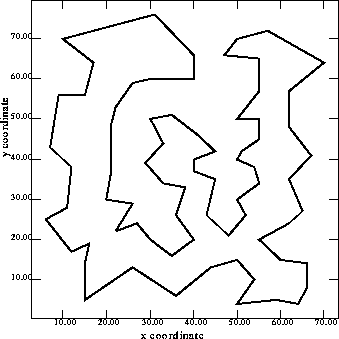
Figure 12: Best solution of 76 cities TSP. Tour length = 538
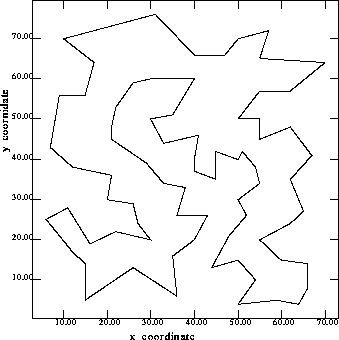
Figure 13: Our best solution of 76 cities TSP with previous information. Tour length = 549
Next: Analysis
Up: Results and Analysis
Previous: Results and Analysis
Sushil J. Louis
Sat Jan 18 20:12:20 PST 1997