Predicting Apple's Stock Price and Volatility using Machine Learning Techniques
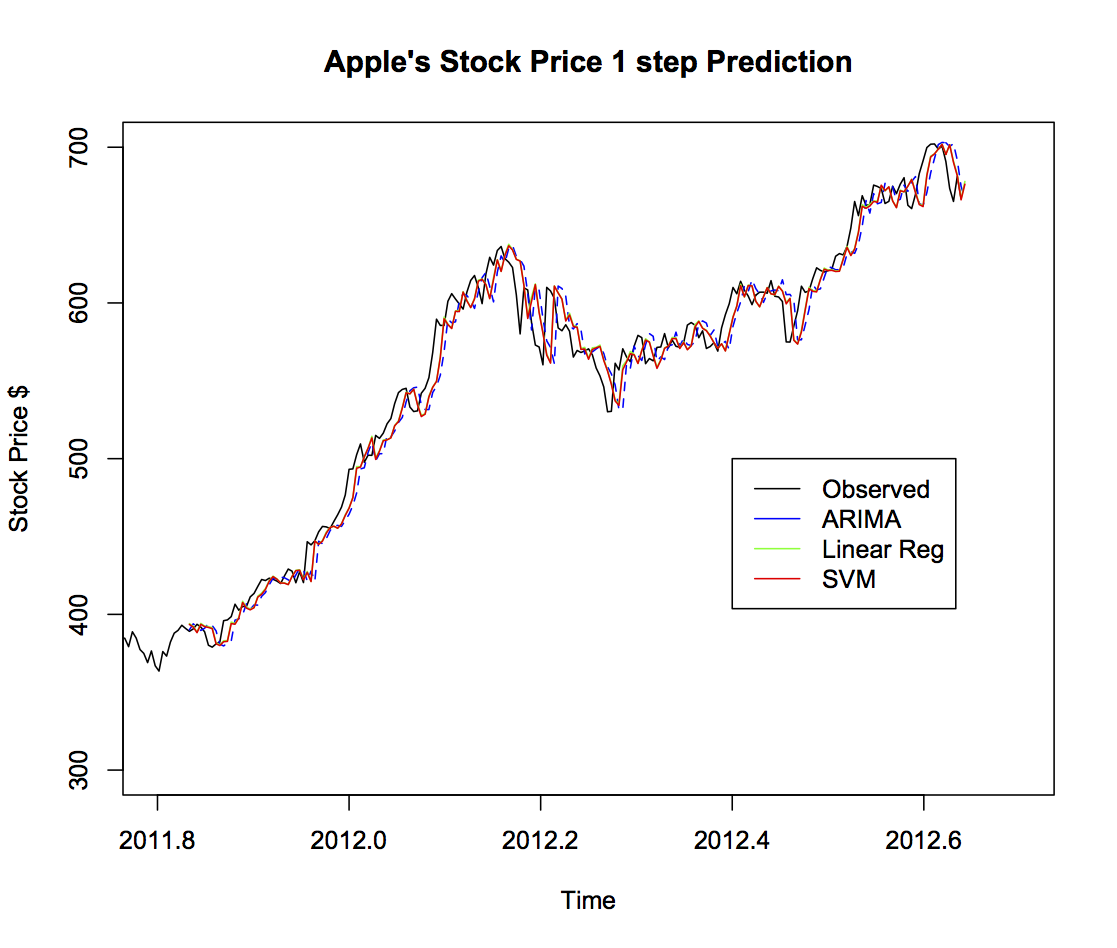
Stock Model Predictions
| 1 Step Predictions |
ARIMA |
LNREG |
SVM |
| Correlation coefficient |
0.9942 |
0.9932 |
0.9933 |
| Mean absolute error |
6.5830 |
7.4064 |
7.4130 |
| Root mean squared error |
9.2552 |
10.0077 |
10.0513 |
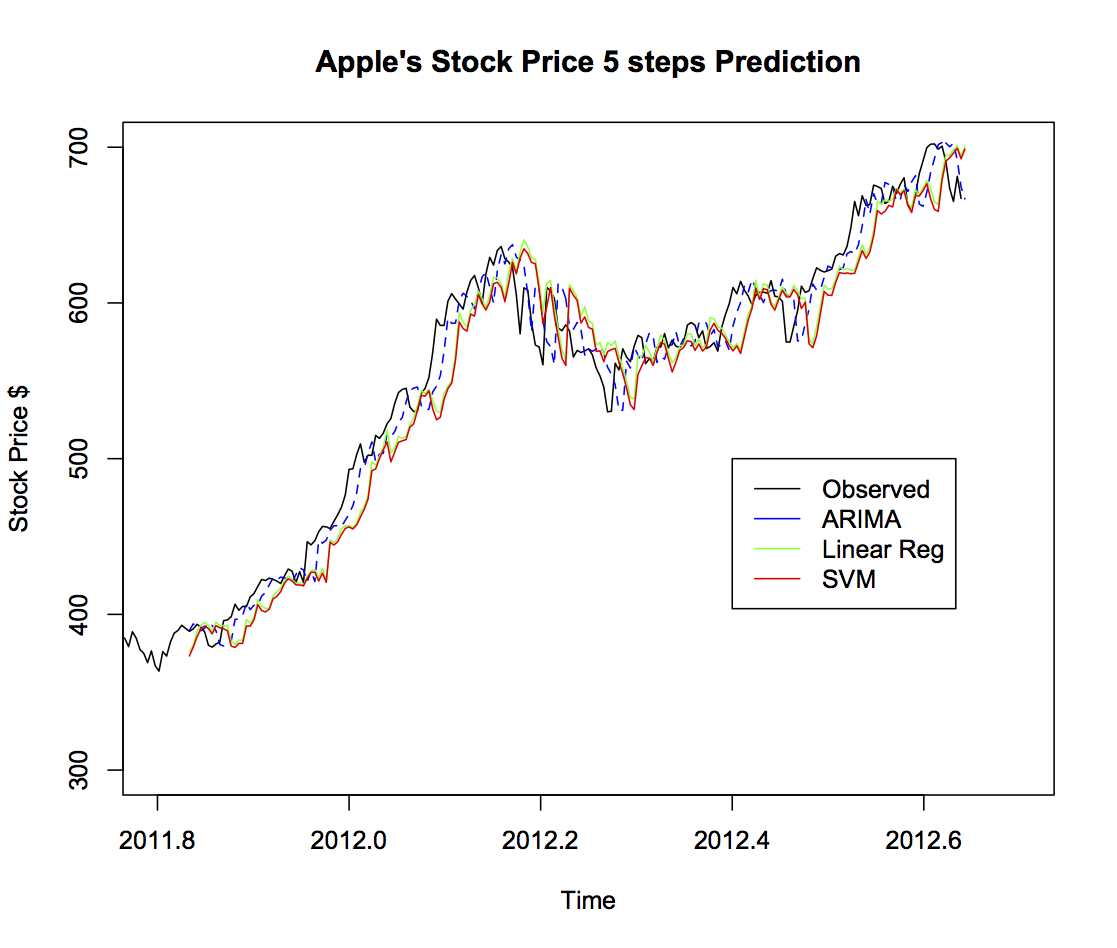
| 5 Steps Predictions |
ARIMA |
LNREG |
SVM |
| Correlation coefficient |
0.9761 |
0.9743 |
0.9746 |
| Mean absolute error |
15.9991 |
16.1276 |
17.2725 |
| Root mean squared error |
20.1693 |
20.5123 |
21.435 |
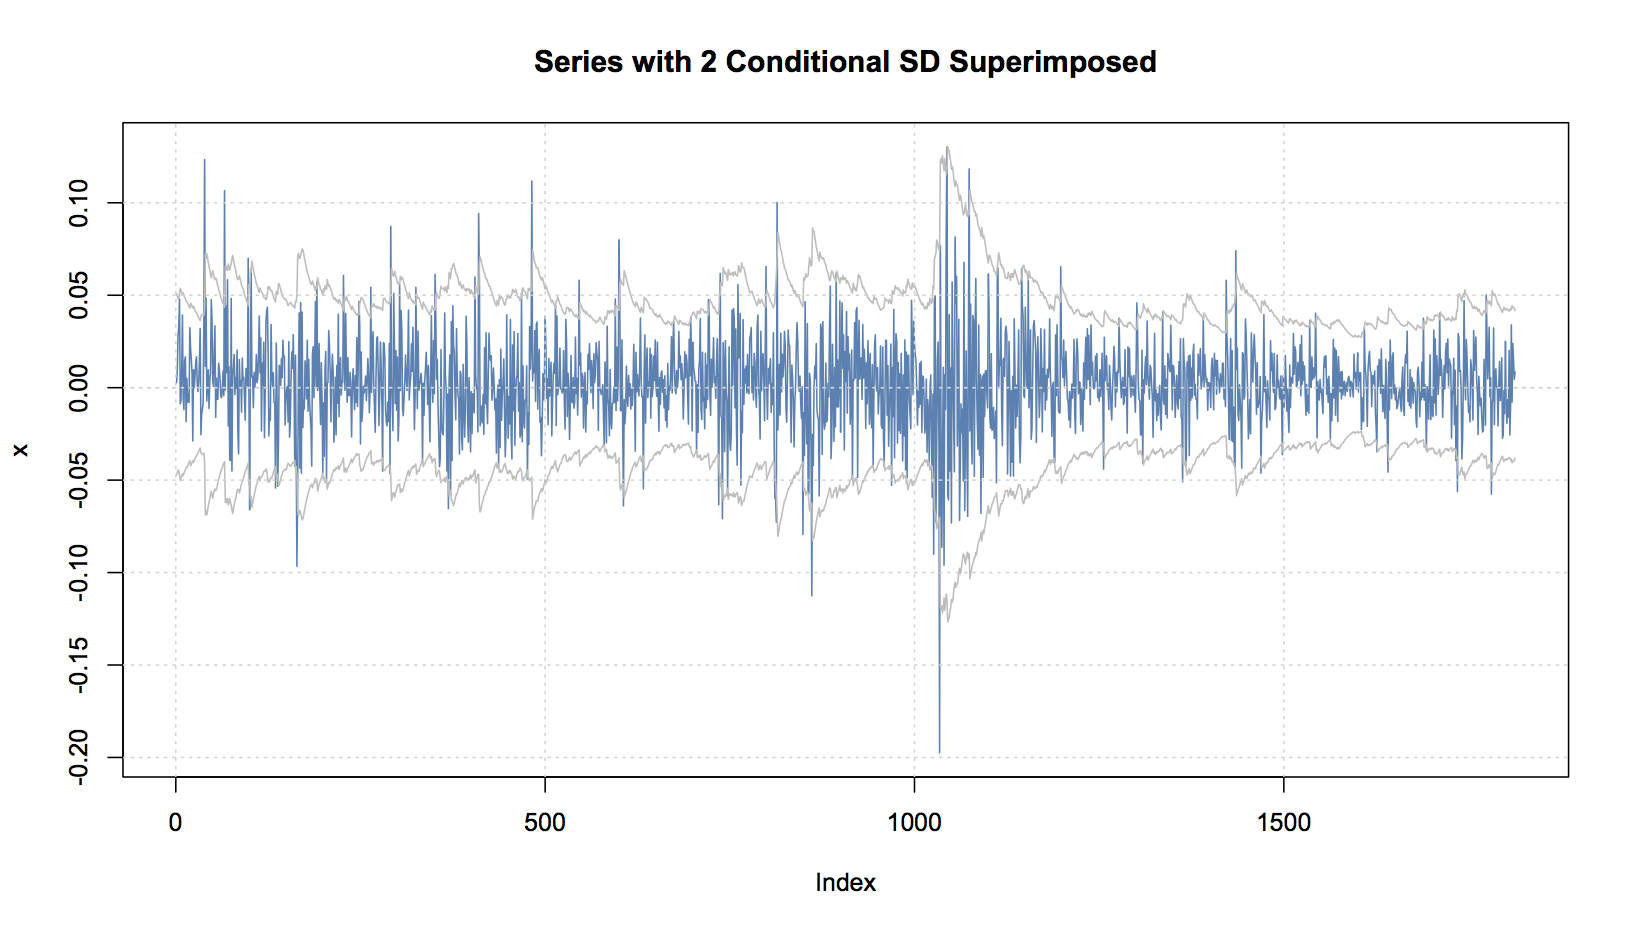
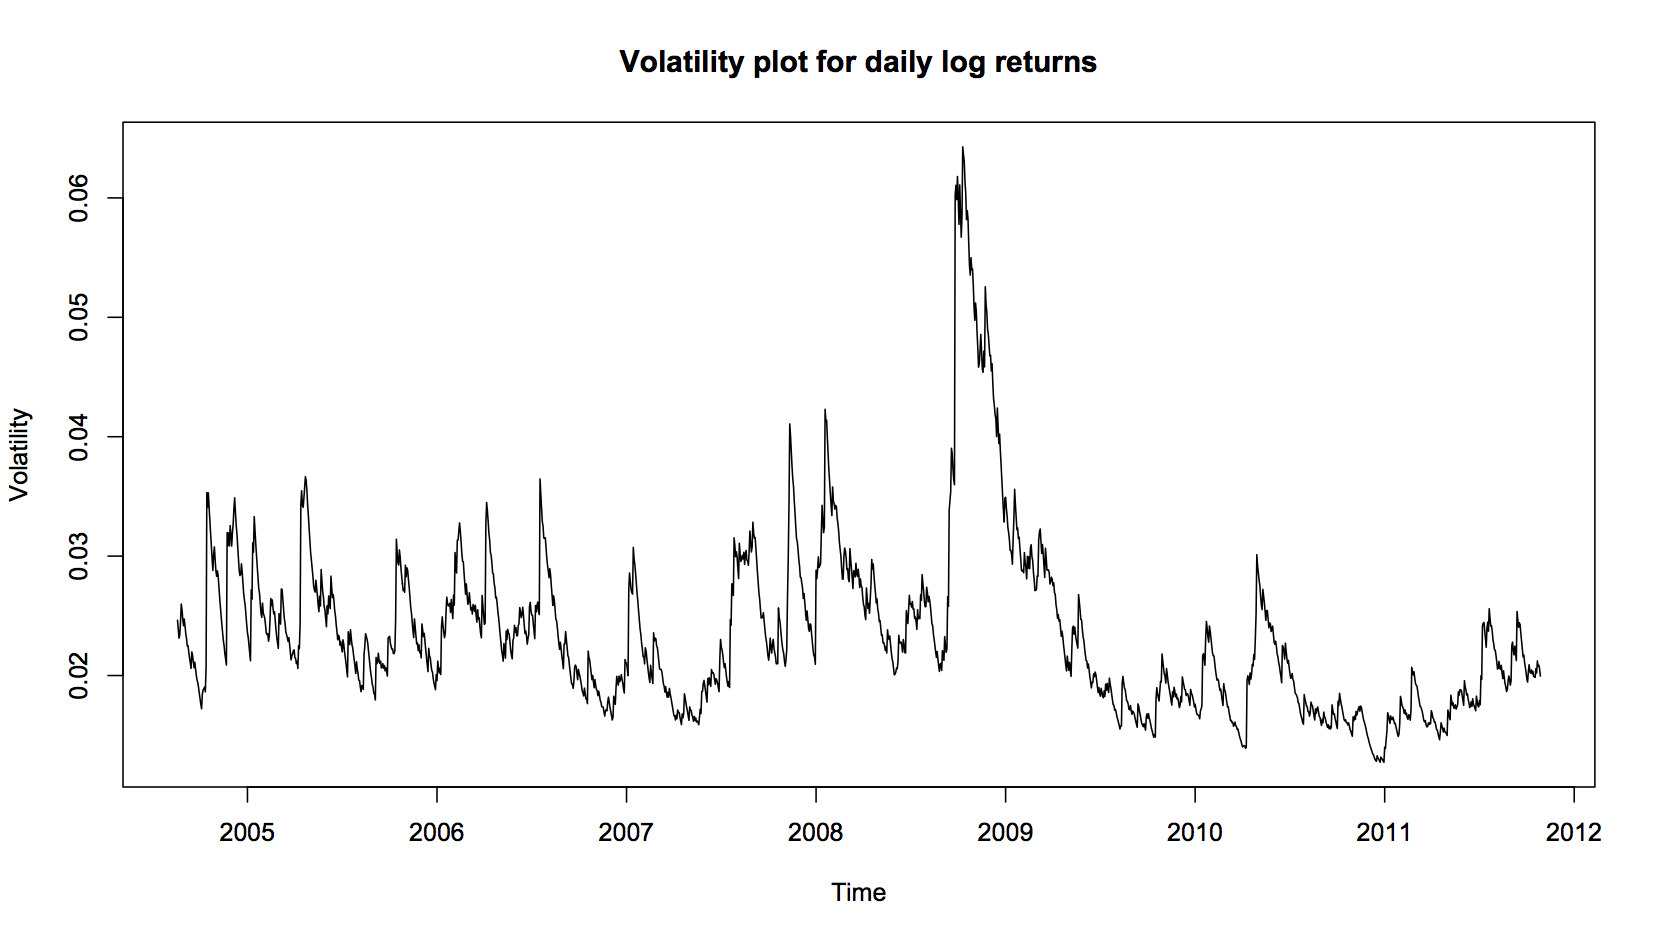
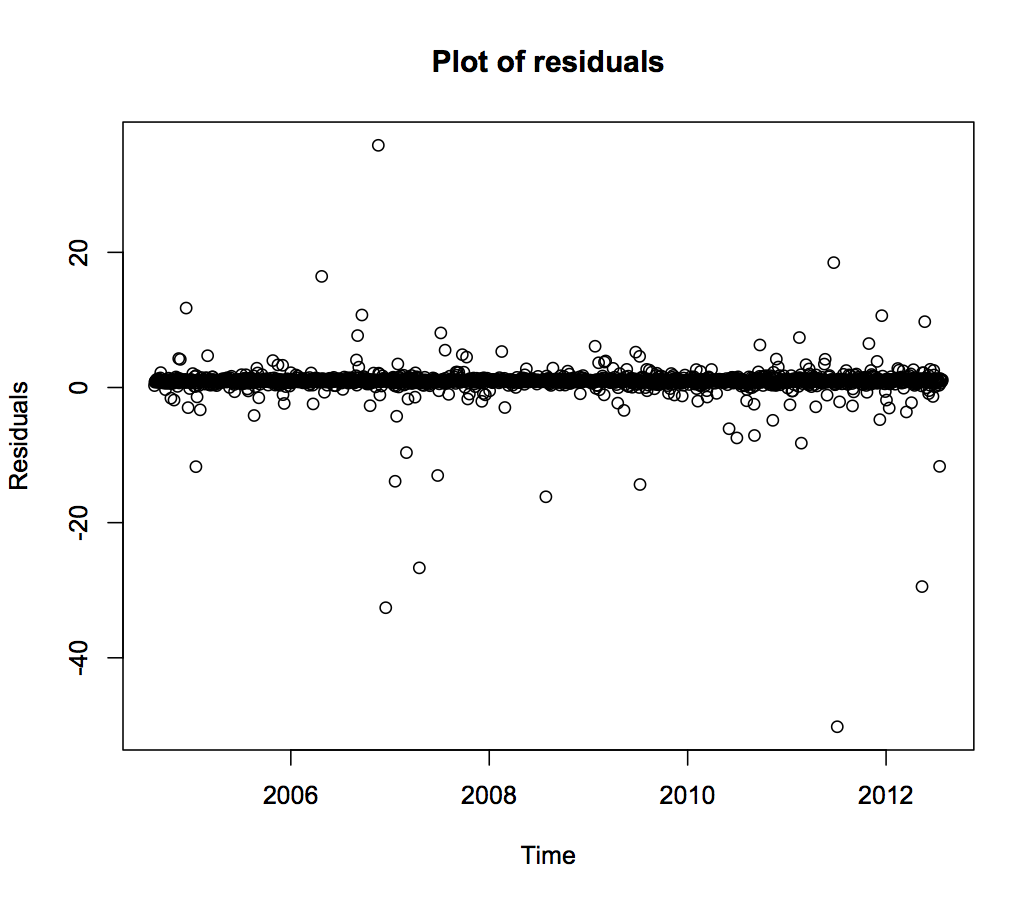
Volatility (GARCH-ARIMA) Model Predictions
Papers
Time series analysis of daily exchange rate between the British Pound and the US dollar (GBP/USD)
The behavior of time series variables such as exchange rates is not consistent and to forecast it is irrational. Despite these assertions, many multinational corporations, dealers in foreign exchange, exporters, importers and speculators continue to make hedging decisions based on forecasted rates using ex-post data as their basis. These hedging decisions are made under the premise that patterns exist in the ex-post data and these patterns provide an indication of future movement of exchange rates, at least in the short run. If such patterns exist, then it is possible in principle to apply modern mathematical tools and techniques such as ARIMA and GARCH to forecast the ex-ante exchange rates more...
DESIGN A NEURAL NETWORK FOR TIME SERIES FINANCIAL FORECASTING: ACCURACY AND ROBUSTNESS ANALISYS
Neural Networks are an artificial intelligence method for modeling complex target functions. For certain types of problems, such as learning to interpret complex realworld sensor data, Artificial Neural Networks (ANNs) are among the most effective learning methods currently know. During the last decade they have been widely applied to the domain of financial time series prediction and their importance in this field is growing. This paper aims to analyze the neural networks for financial time series forecasting. Specifically the ability to predict future trends of North American, European and Brazilian Stock Markets. Accuracy is compared against a traditional forecasting method, generalized autoregressive conditional heteroscedasticity (GARCH). Furthermore, it is examined the best choice of network design for each sample of data. It was concluded that ANNs do have the capability to forecast the stock markets studied and, if properly trained, can improve the robustness according to the network structure. more...
Using Artificial Neural Networks ToForecast Financial Time Series
This thesis investigates the application of arti�cial neural networks (ANNs) for forecasting �nancial time series (e.g. stock prices). The theory of technical analysis dictates that there are repeating pat- terns that occur in the historic prices of stocks, and that identifying these patterns can be of help in forecasting future price developments. A system was therefore developed which contains several "agents", each producing recommendations on the stock price based on some aspect of technical analysis theory. It was then tested if ANNs, using these recommendations as inputs, could be trained to forecast stock price uctuations with some degree of precision and reliability. The predictions of the ANNs were evaluated by calculating the Pearson correlation between the predicted and actual price changes, and the "hit rate" (how often the predicted and the actual change had the same sign). Although somewhat mixed overall, the empirical results seem to indicate that at least some of the ANNs were able to learn enough useful features to have significant predictive power. more...
Noisy Time Series Prediction using a RecurrentNeural Network and Grammatical Inference
Financial forecasting is an example of a signal processing problem which is challenging due to small sample sizes, high noise, non-stationarity, and non-linearity. Neural networks have been very successful in a number of signal processing applications. We discuss fundamental limitations and inherent difficulties when using neural networks for the processing of high noise, small sample size signals. We introduce a new intelligent signal processing method which addresses the difficulties. The method proposed uses conversion into a symbolic representation with a self-organizing map, and grammatical inference with recurrent neural networks. We apply the method to the prediction of daily foreign exchange rates, addressing difficulties with non-stationarity, overfitting, and unequal a priori class probabilities, and we find significant predictability in comprehensive experiments covering 5 different foreign exchange rates. The method correctly predicts the direction of change for the next day with an error rate of 47.1%. The error rate reduces to around 40% when rejecting examples where the system has low confidence in its prediction. more...
Data
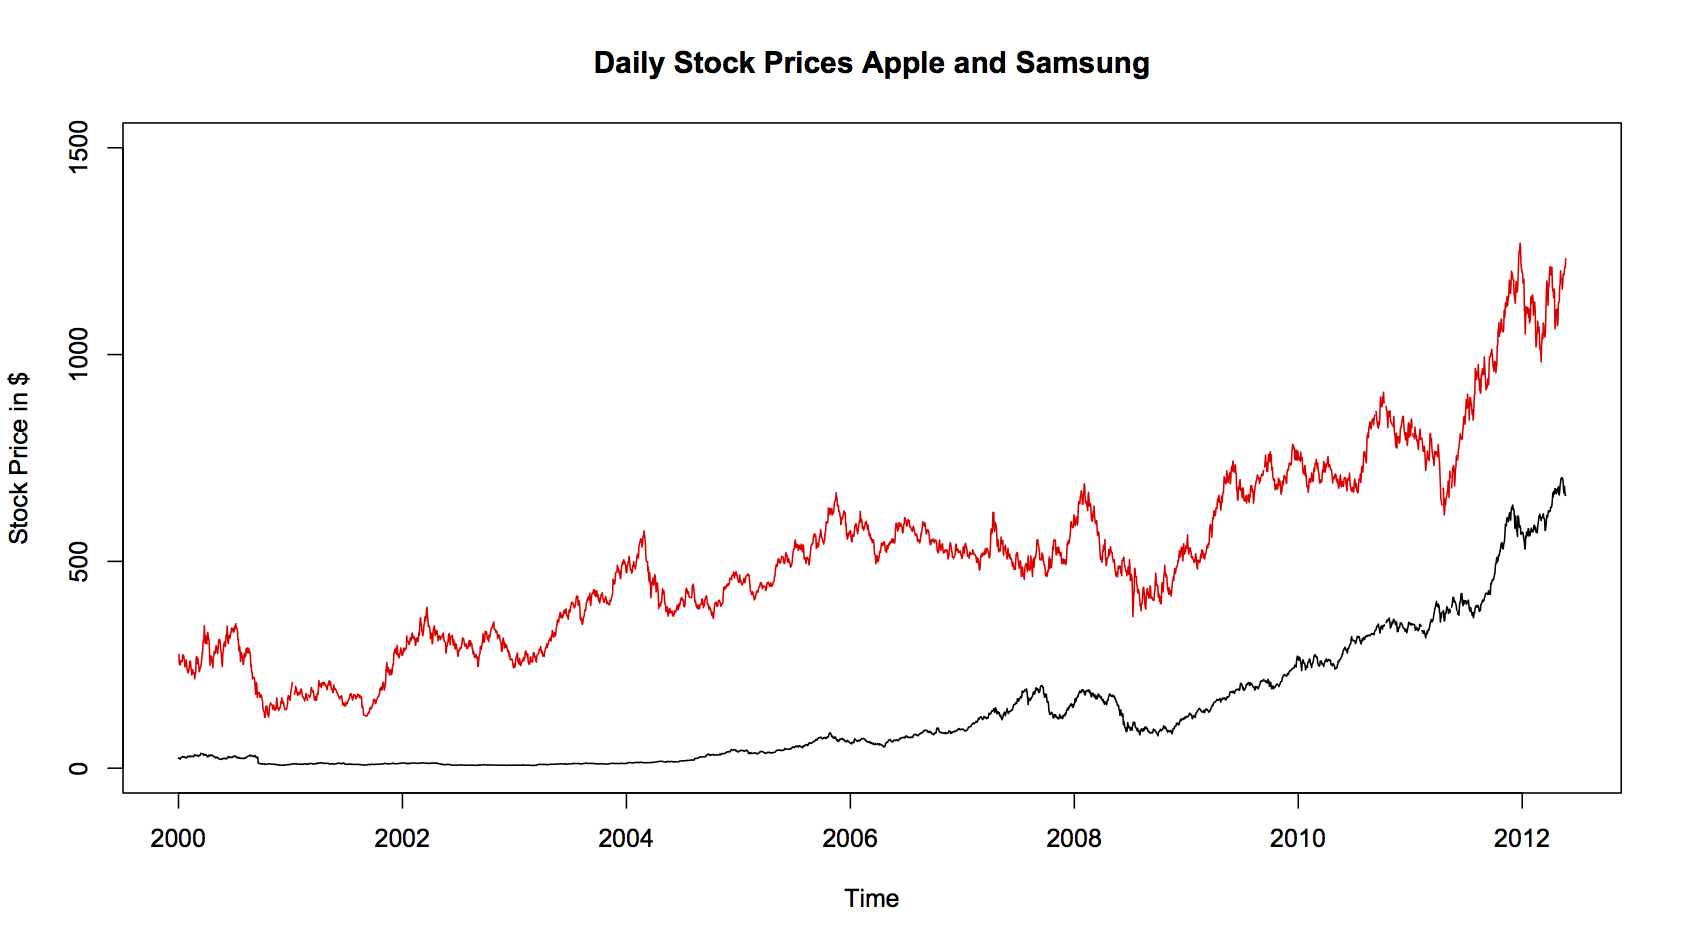
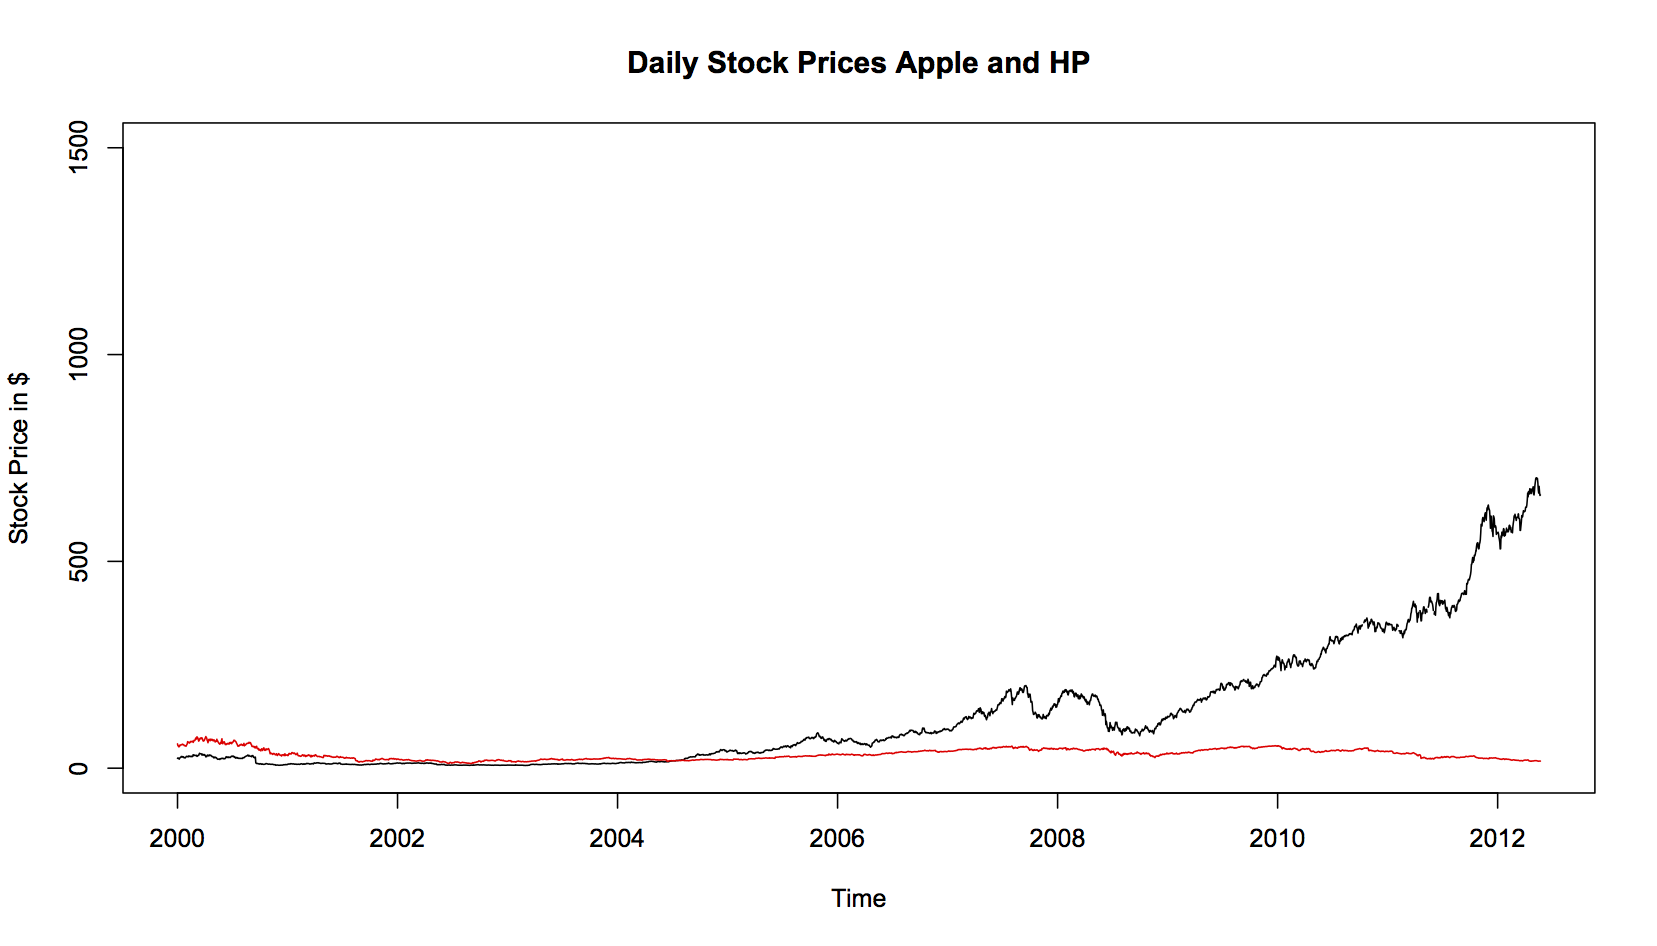
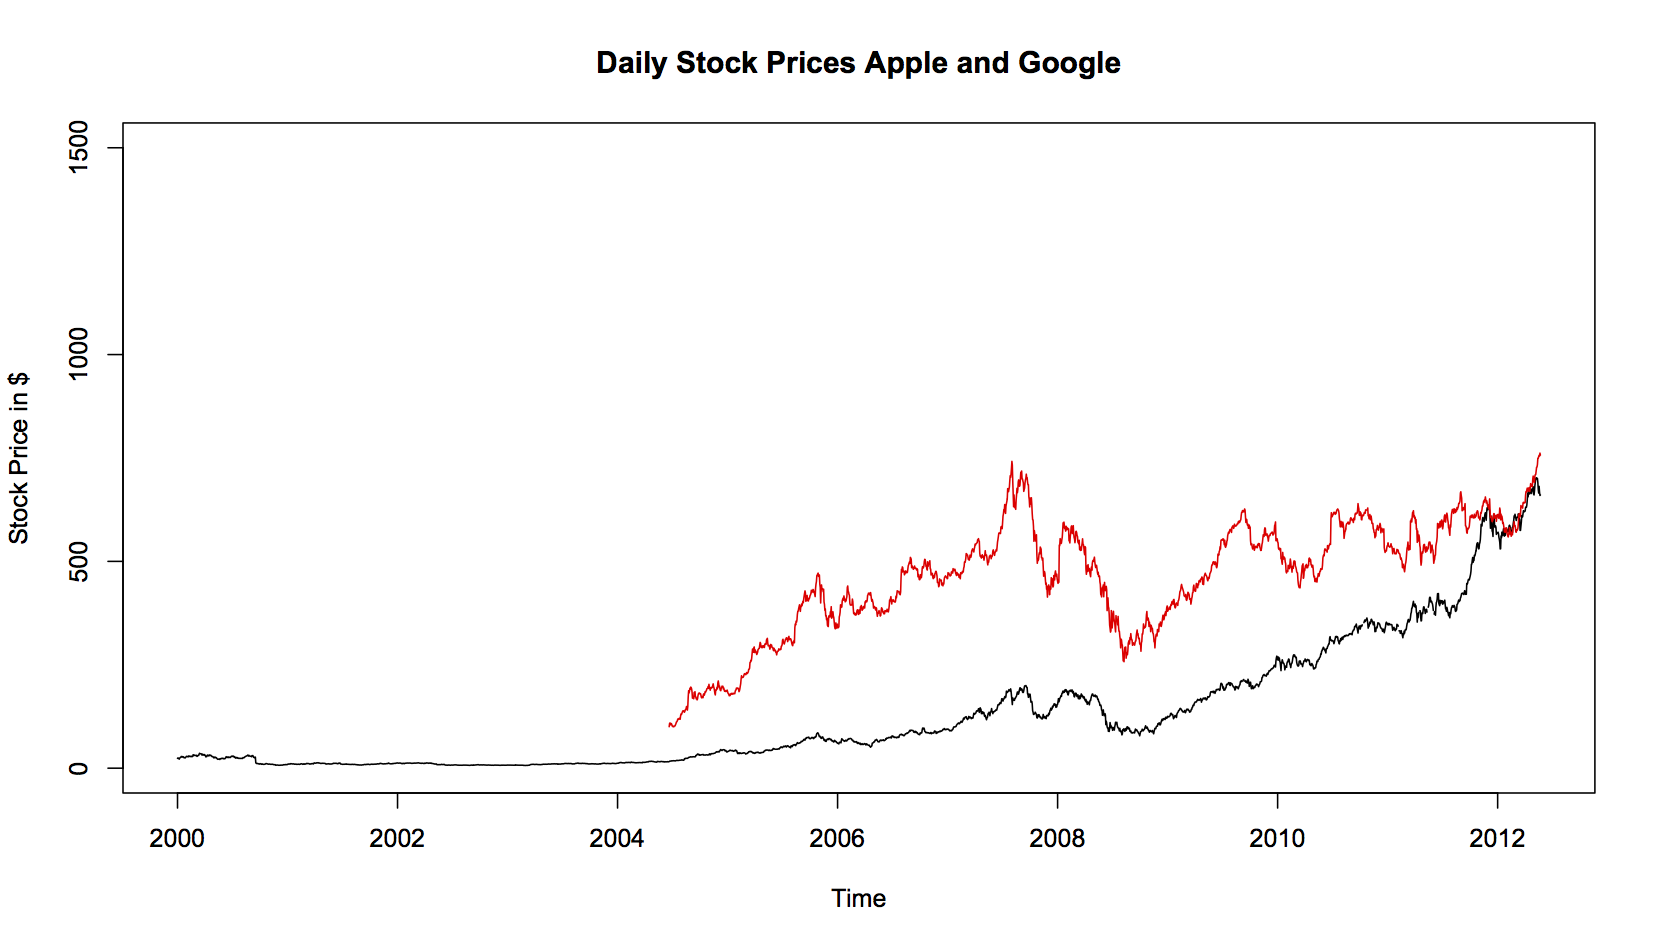
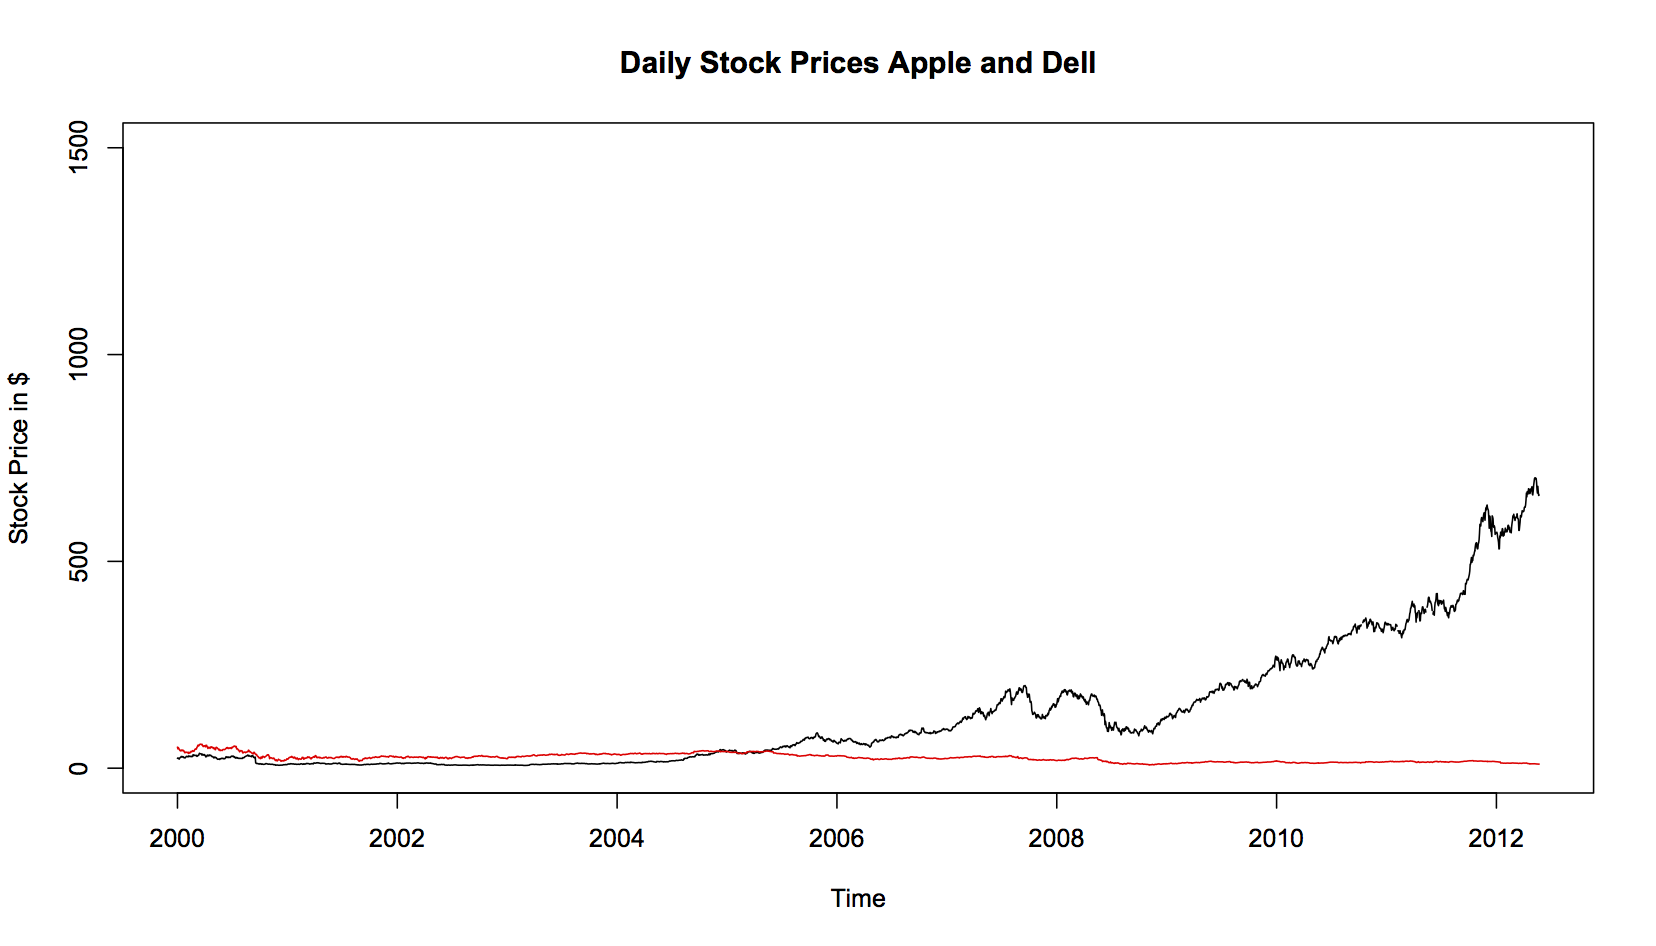
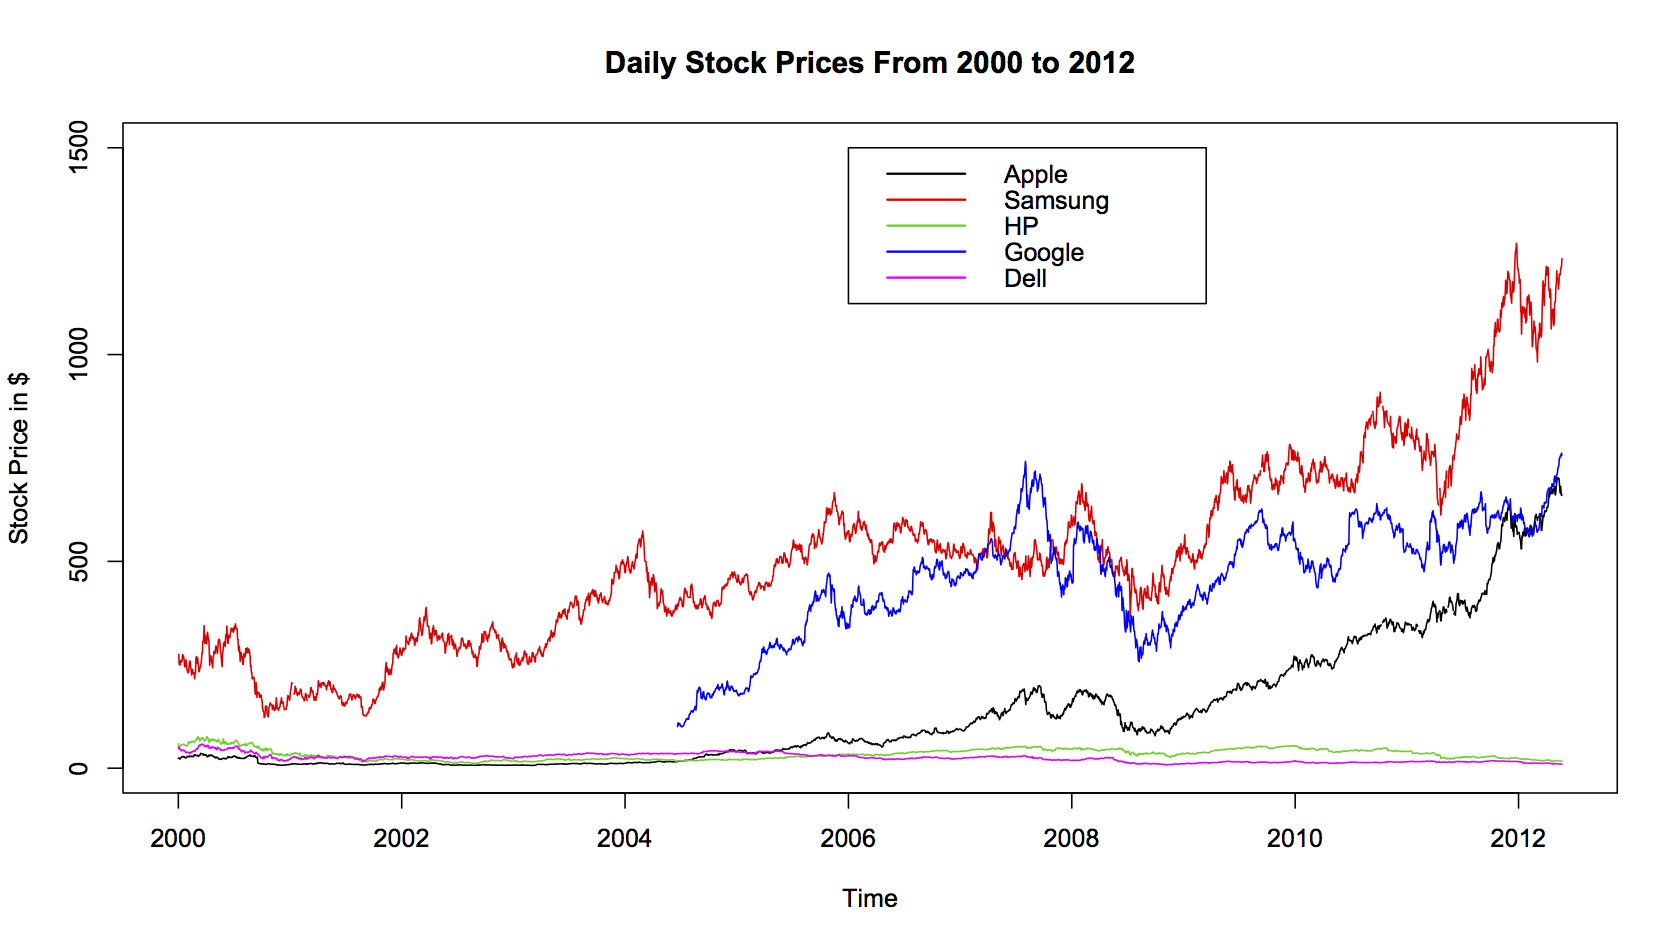
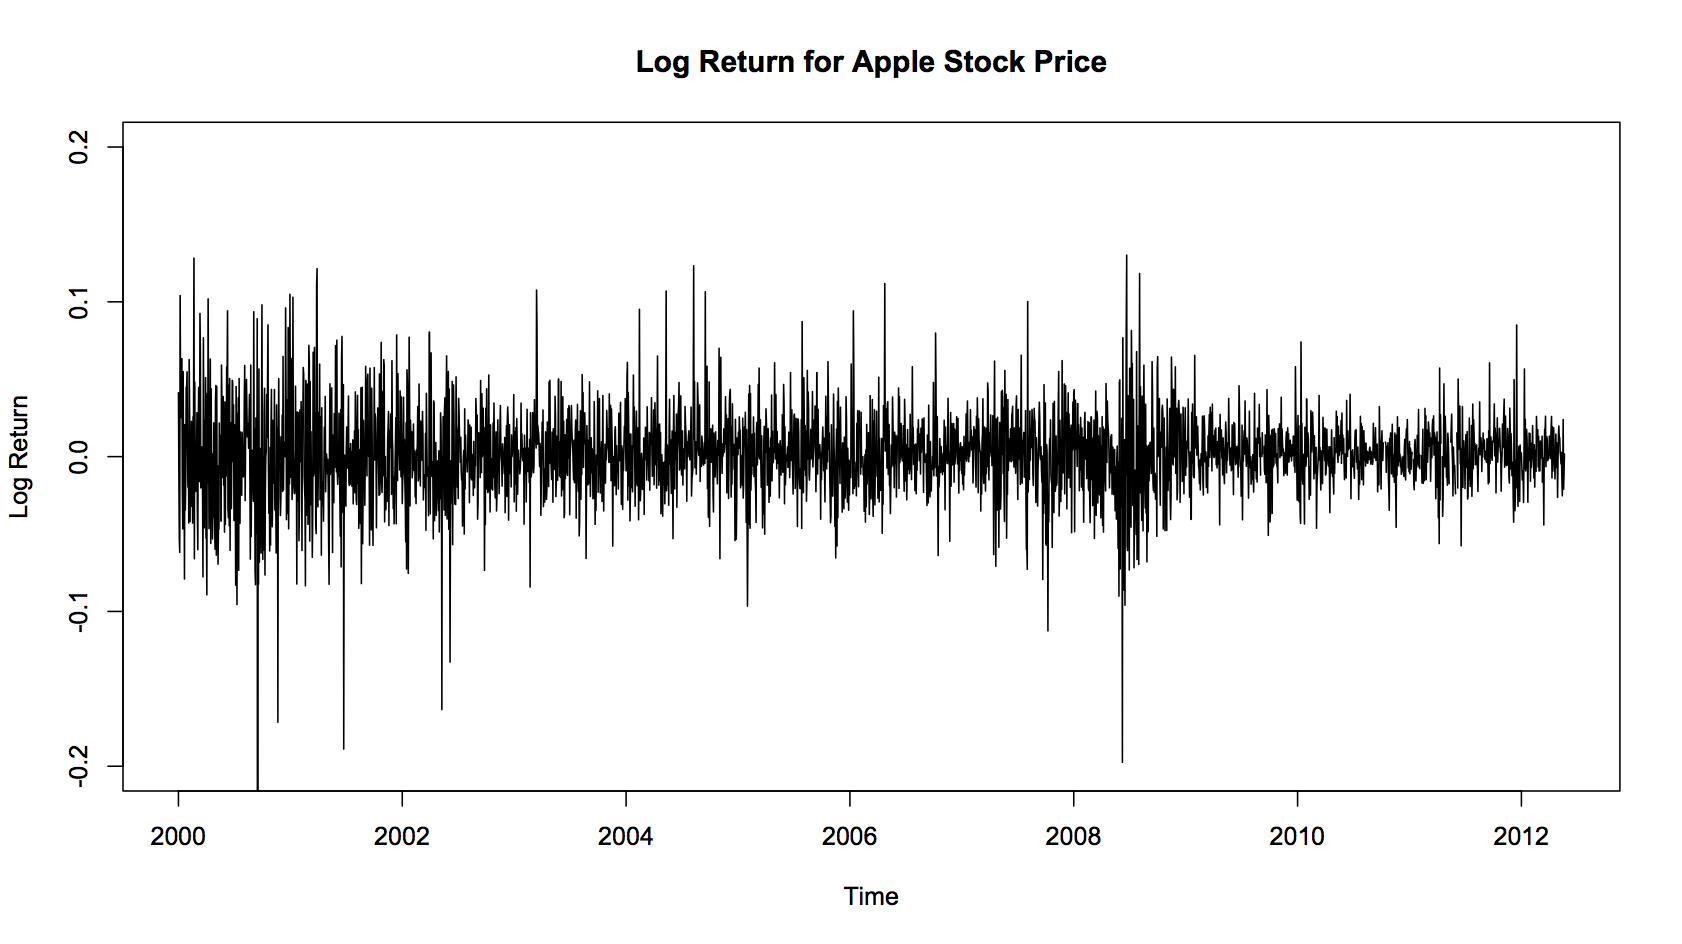
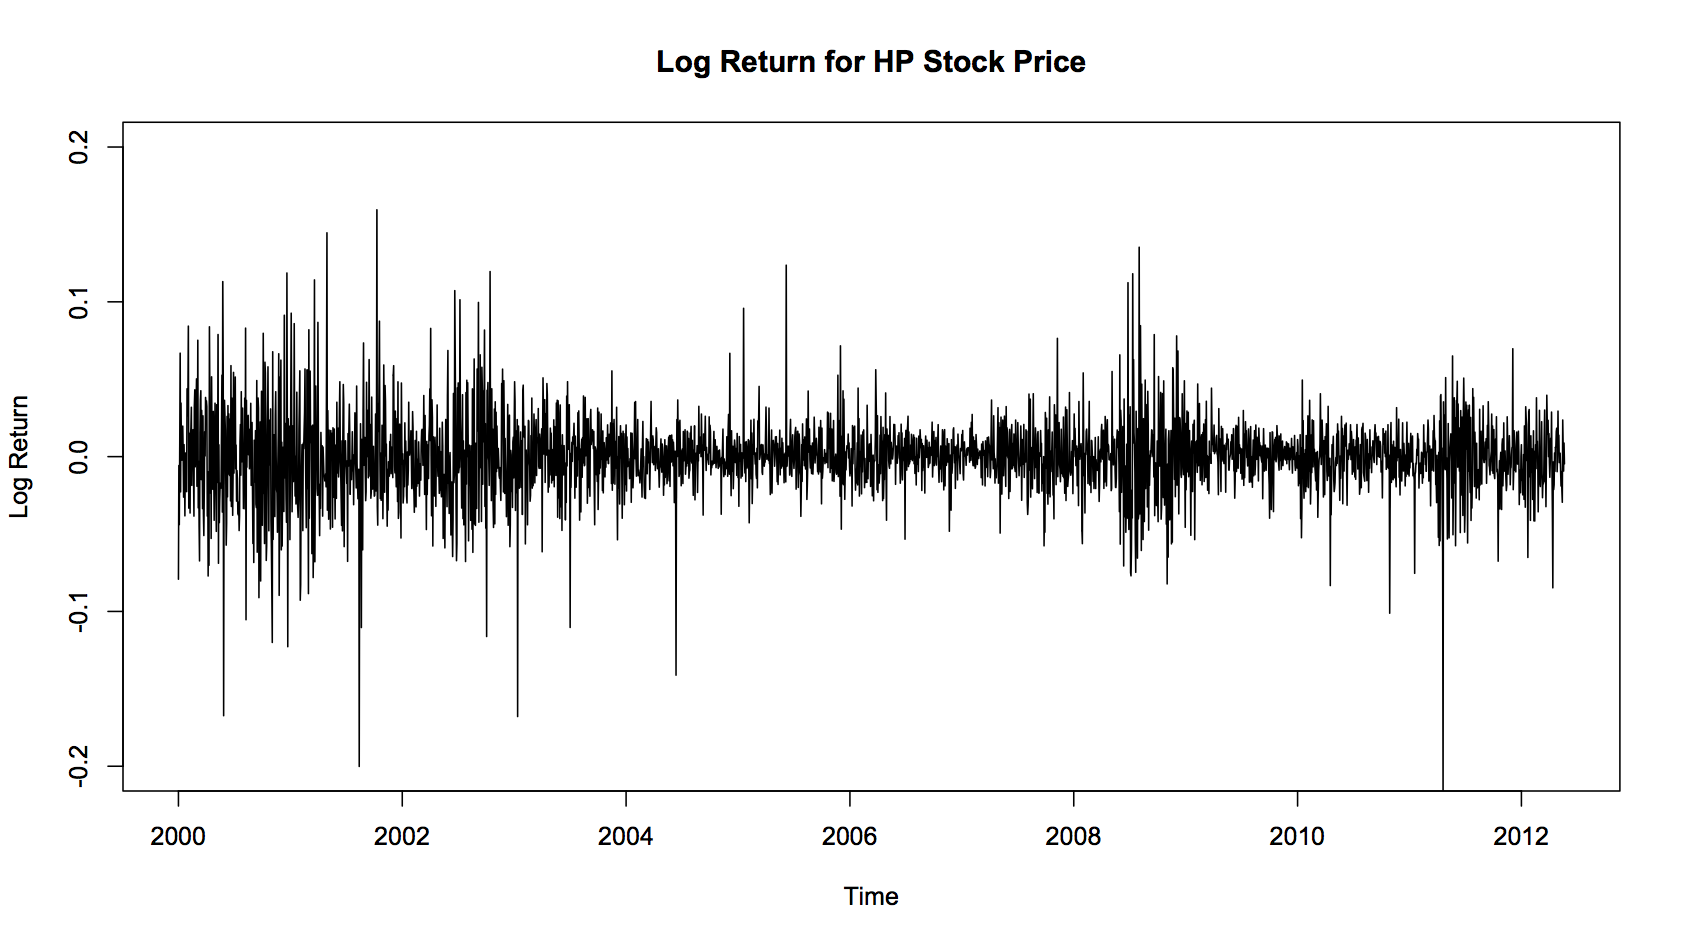
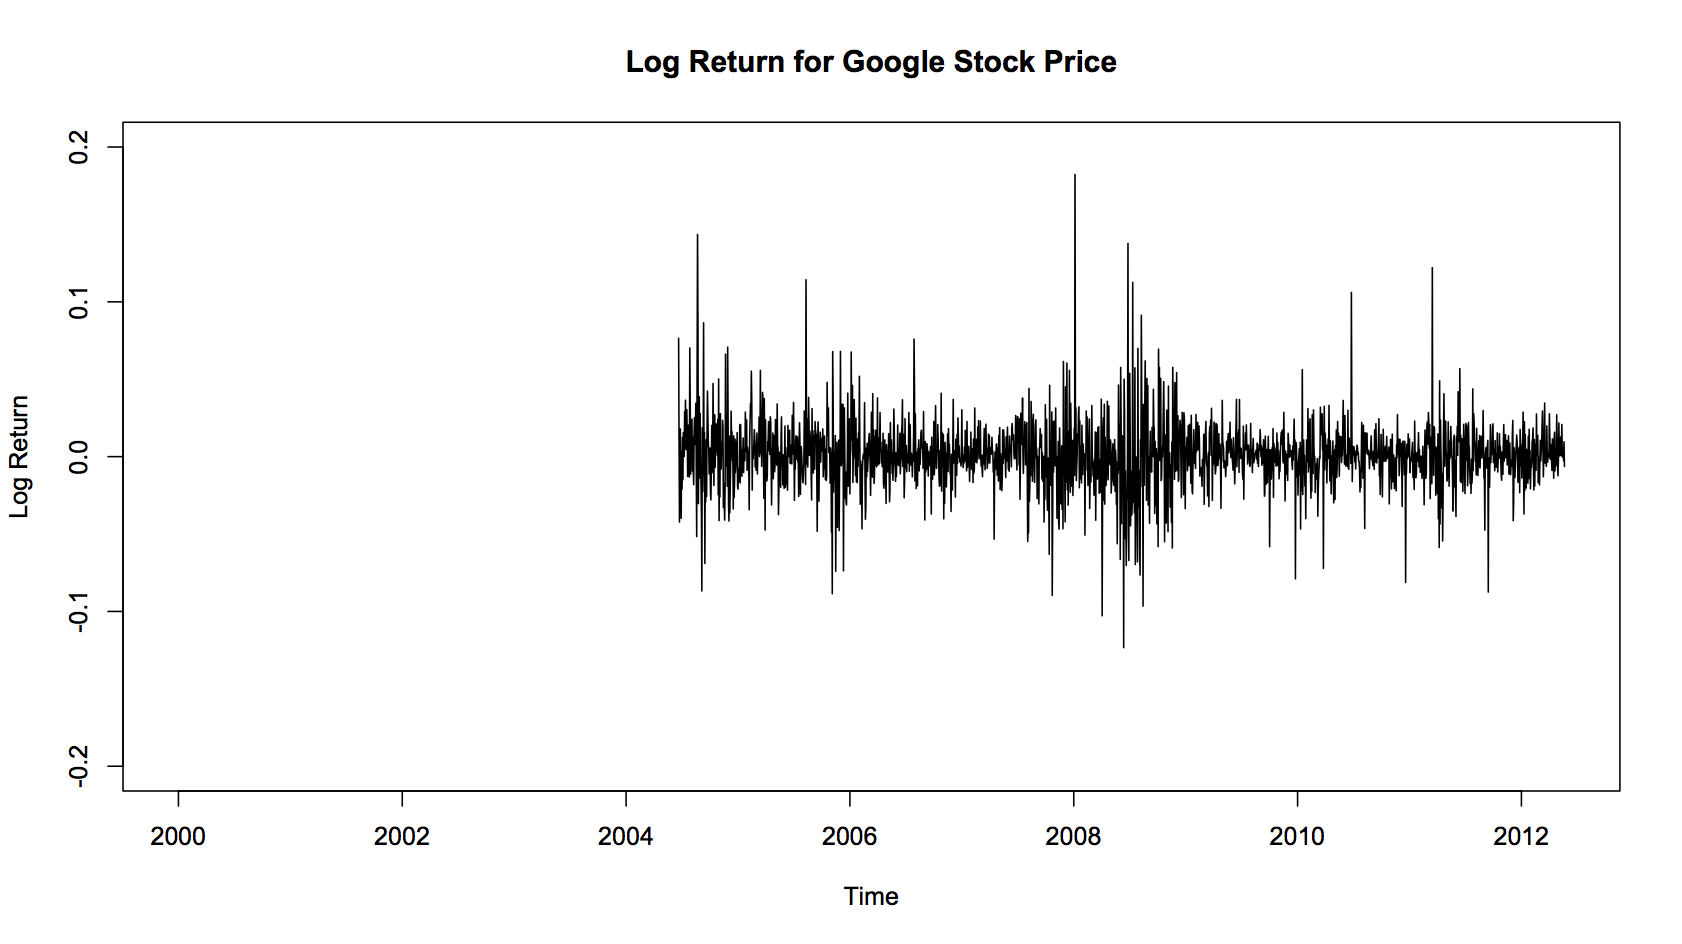
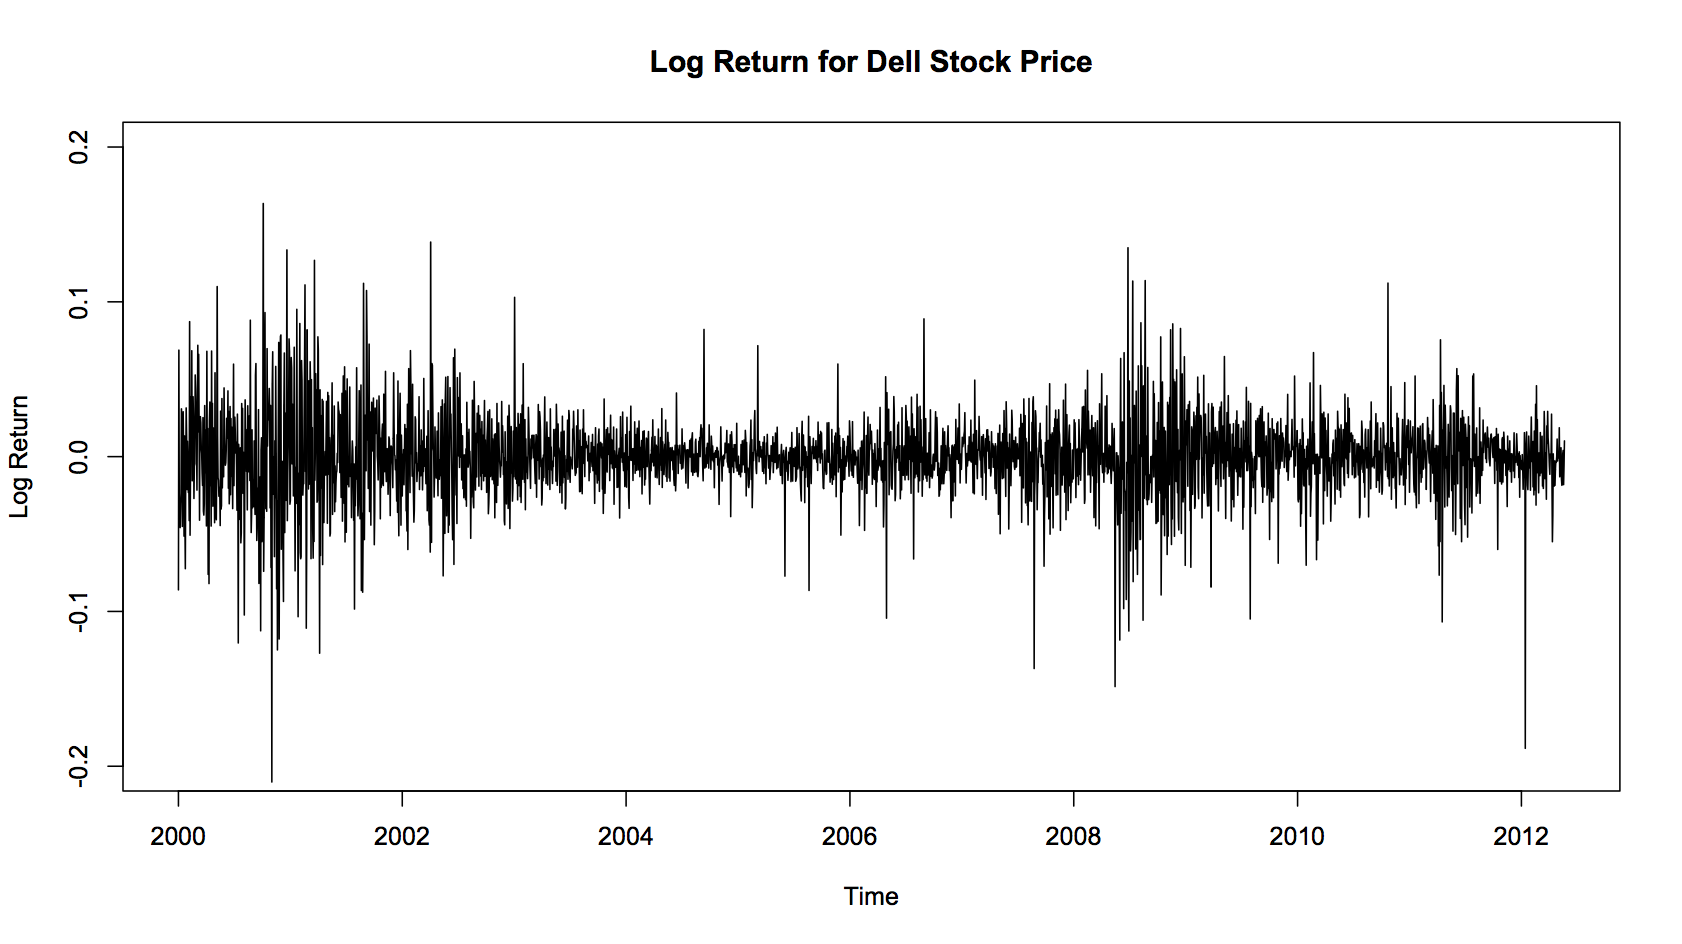
Daily stock price data for Apple Inc. from the inception of the iphone 2000 to 2012 from google. apple data
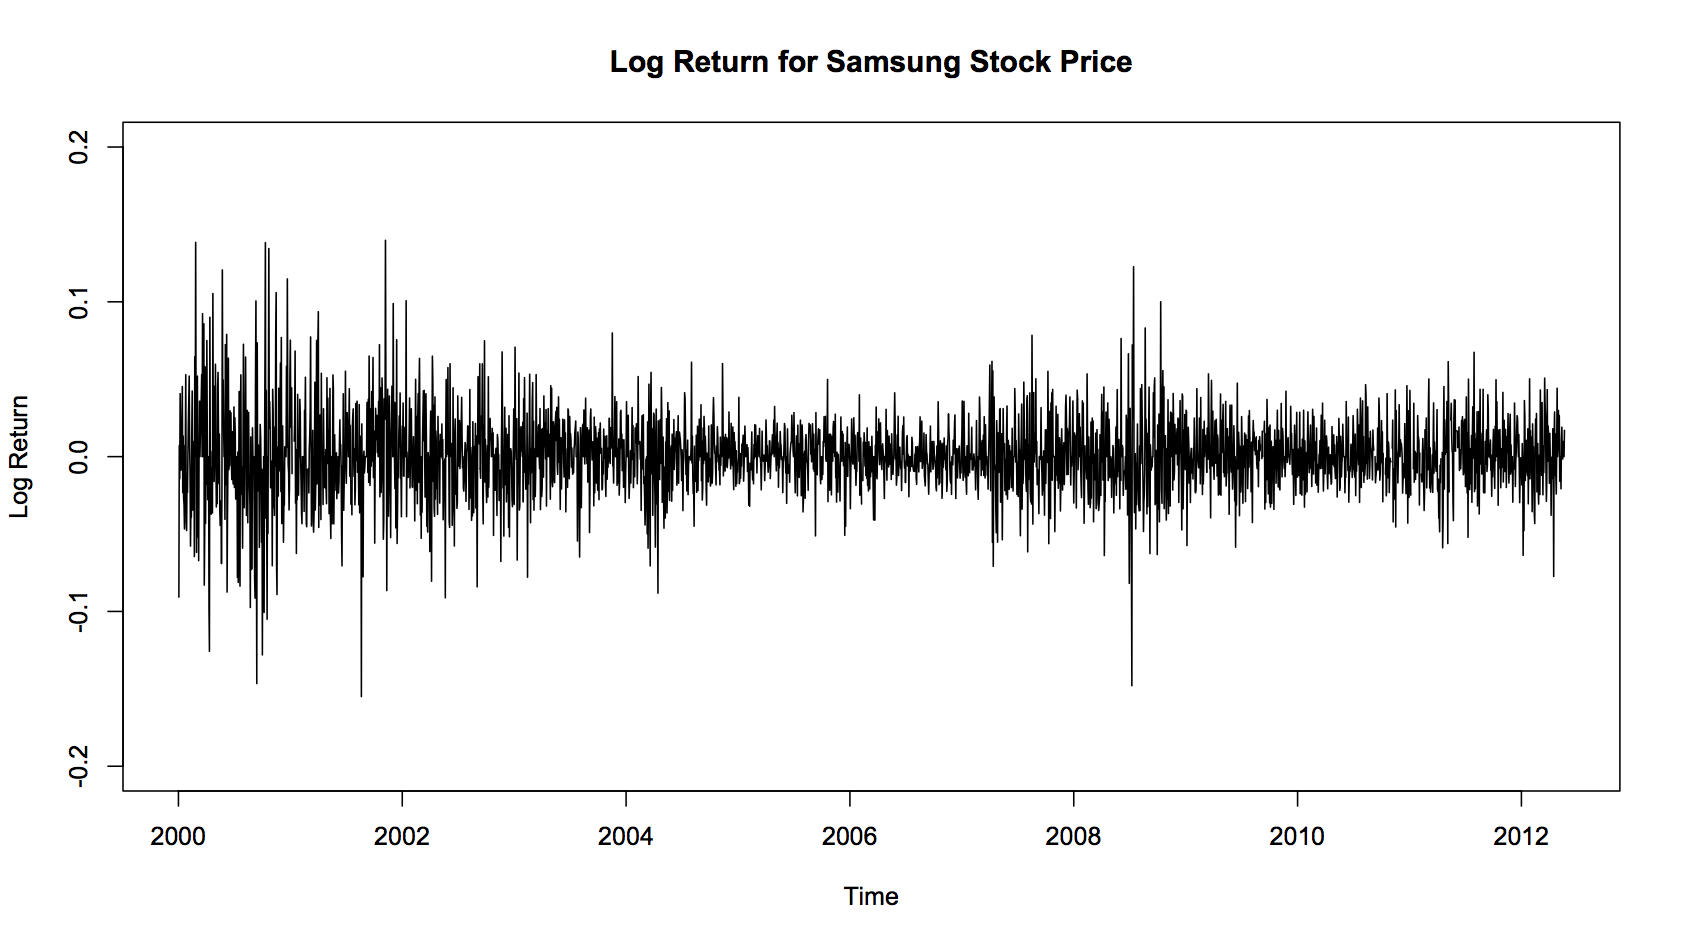
Daily stock price data within the same time period for Samsung Electronics Co. Ltd. from yahoo samsung data
Timeline of Apple Inc. products
product data
1 Step Predictions Of Stock Price
Instances: 1813
Attributes: 8
| Apple_Open, |
Apple_High, |
Apple_Low, |
App_Volume, |
Samsung, |
HP, |
Dell, |
Google |
Training: 1813
Testing: 205
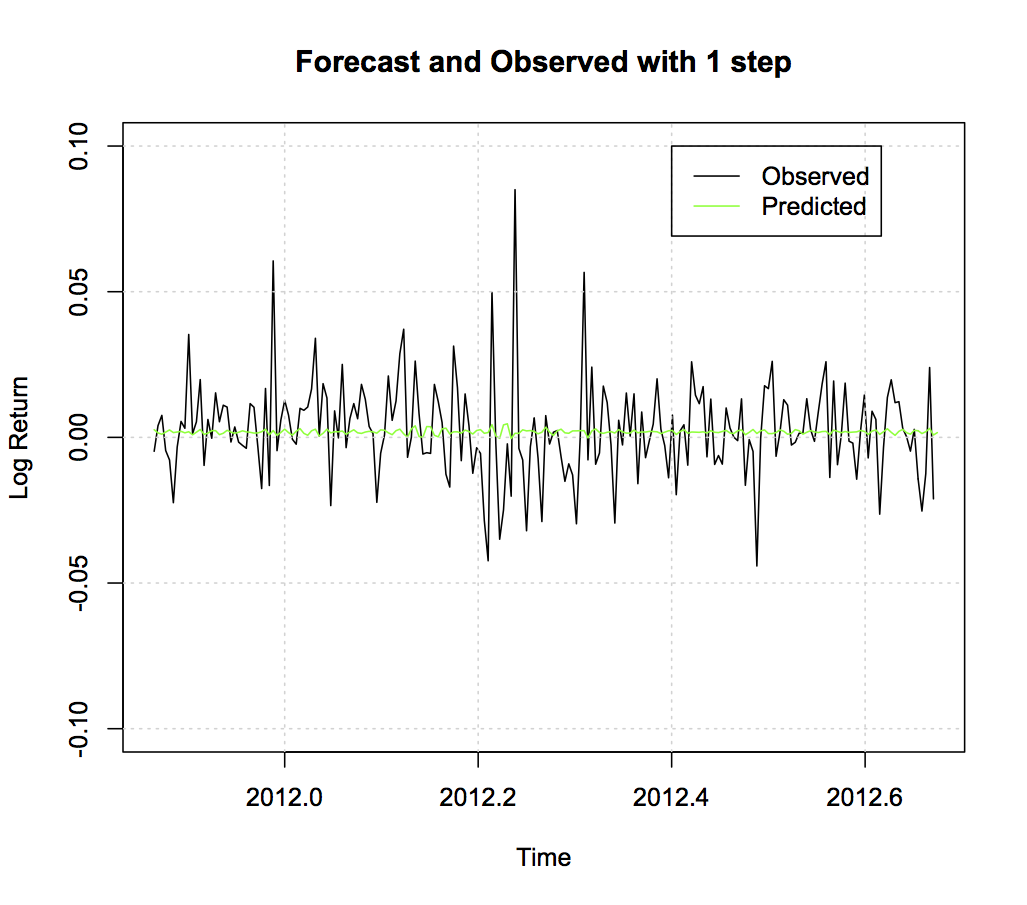
ARIMA(2,0,2) Model Results
| Correlation coefficient |
0.2148 |
| Mean absolute error |
0.0118 |
| Root mean squared error |
0.0164 |
Linear Regression Model
Training: 10-fold cross-validation
apple_closed = 0.7638 * apple_open - 0.1302 * apple_low - 0.018 * apple_vol +0.0589 * samsung - 0.0508 * hp - 0.0466 * dell + 0.423
| |
Training |
Testing |
| Correlation coefficient |
0.6925 |
0.7027 |
| Mean absolute error |
0.0026 |
0.0026 |
| Root mean squared error |
0.004 |
0.004 |
Multilayer Perceptron With Back Propagation
Hiden Layer: 5
Learning Rate: 0.3
Momentum: 0.2
Training: 10-fold cross-validation
| |
Training |
Testing |
| Correlation coefficient |
0.654 |
0.7338 |
| Mean absolute error |
0.0028 |
0.0025 |
| Root mean squared error |
0.0043 |
0.0038 |
Support Vector Regression
C: 1
Kernel: Polykernel
Regression Optimizer: RegSMOImproved
Training: 10-fold cross-validation
| |
Training |
Testing |
| Correlation coefficient |
0.6977 |
0.7012 |
| Mean absolute error |
0.0026 |
0.0026 |
| Root mean squared error |
0.004 |
0.004 |
1 Step Predictions Of Volatility
ARIMA(2,0,2)-GARCH(1,1) Model Results
| Correlation coefficient |
|
| Mean absolute error |
|
| Root mean squared error |
|