Home
Overview
Methodology
Results
Publications
Members
Links
Background Modeling Background modeling

Background Modeling Based on Support Vector Regression

Support vector regression is to construct a function that has small deviation from actually obtained targets for all the training data, meanwhile, specify an upper bound on the fraction of training points allowed to lie outside of a distance from the regression estimation, called as -insensitive support vector regression [2]. In our work, the support vector regression model exploits the training inputs of intensity values for each pixel in the background scene to estimate its probability distribution function as the background model.
Then, the formed probability distribution function is used to classify the new input data sets belonging to the background or not.

Supposed there are training inputs , where are intensity values for each pixel in the background scene, are the probability of each pixel being labeled as background (i.e., in the training data, we manually set the probabilities of those pixels belonging to the background with high value). For each pixel, the SVR approximation for the probability of its intensity belonging to background can be calculated as follows,


where is kernel function and are Lagrange multiplier parameters.
The formulation for -insensitive support vector regression is to find values for Lagrange multiplier parameters that minimize the following quadratic objective function:

where and
By using different kernels, SVR implements a variety of estimation functions (e.g., a sigmoidal kernel corresponding to a two-layer sigmoidal neural network while a Gaussian kernel corresponding to a radial basis function (RBF)). In our work, the Gaussian radial basis kernel is exploited as follows:

Background Representation

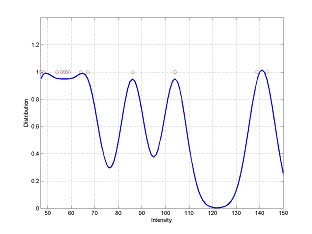
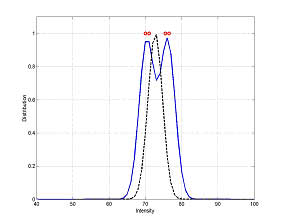
Figure 1 shows different representations for modeling background based on small training data at a fixed spatial position, such as support vector regression, supervised mixture of Gaussian distribution with 2 and 4 clusters, single Gaussian distribution. In Figure 1, training inputs and the estimated intensity distribution were described as red cycles and blue curve, respectively. In Figure 1 (d), a comparison between SVR and single Gaussian distribution labeled as blue curve and dash curve, respectively, has been shown. From Figure 1, it can be seen that support vector regression provide more accurate estimation function to fit the training data than mixture of Gaussian distribution and single Gaussian distribution.

(a) Support vector regression
(b) Mixture of Gaussian distribution (clusters=2)
(c) Mixture of Gaussian distribution (clusters=4)
(d)Support vector regression (blue) Vs. Single Gaussian distribution (dash)

Back to top


Reference:

[1] Marti Hearst, "Trends and controversies - support vector machines". IEEE Intelligent Systems, 13(4): 18-28,1998

[2] Alex J. Smola and Bernhard Scholkopf, "A tutorial on support vector regression",
NeuroCOLTS technical report Series NC2-TR-1998-030, Oct. 1998

[3] J. Ma and J. Theiler, "Accurate on-line support vector regression", Neural Computation, 15,2683-2703,2003.

[4] J. W. Davis and V. Sharma, "Robust background-subtraction for person detection in thermal imagery", IEEE,CVPR,2004

[5] J. W. Davis and M. A. Keck, "A two-stage template approach to person detection in thermal imagery", IEEE,CVPR,2005

Home | Overview | Methodology | Results | Publications |Members|Links

 
For problems or questions regarding this web contact [Junxian Wang].
Last updated: 11/14/05.