The test problem presented in this section is the design of a truss with a span of 100 feet and an evenly distributed vertical load that has an intensity of 600 pounds per linear foot. Since the loading is symmetric, for simplicity, we designed only for half trusses. This simplification restricts the trusses to have an even number of panels, but does not affect the validity or feasibility of our methodology. We assume the following:
Some typical configurations of the initial GA population were already shown in figure 4. The population size for the genetic algorithm was 50 and it ran for a 100 generations. We used the CHC elitist selection strategy in which for a population of size N, the offspring double the size of the population and the N best are chosen for the next generation from the 2N population of parents and offspring. Since elitism increases selection pressure and because the heuristic initialization of the population reduces diversity we used a crossover probability of 1.0 and a mutation probability dependent on the mutation cite. The probability of mutating a bit in cross sectional area of a member or height of a node was 0.07 and the probability of adding/removing a member was proportional to the relative stress on the member (removal), or displacement at a corresponding node (addition). Empirical testing established these parameter values as better than the more traditional values of 0.66 and 0.001 for crossover and mutation probabilities. The figures shown below are the best results from more than 20 genetic algorithm runs with different random seeds and parameters.
Figure 6 shows several intermediate truss designs (half trusses)
produced by the GA, in which the best was found at generation 67. Numbers
next to truss members are their cross sectional areas in square inches. A
typical rate of convergence is depicted in figure 7 where we plot
weight in pounds versus generation number. We use this graph of the genetic
algorithm's performance instead of the average over many runs since a designer
will be more interested in the best result rather than an average. The genetic
algorithm quickly reduces the weight and finds the best solution for the run in
the ![]() generation. This is typical behavior for the runs that we
observed. Table 1 summarizes some of the major structural
characteristics of the design solutions shown in figure 6.
generation. This is typical behavior for the runs that we
observed. Table 1 summarizes some of the major structural
characteristics of the design solutions shown in figure 6.
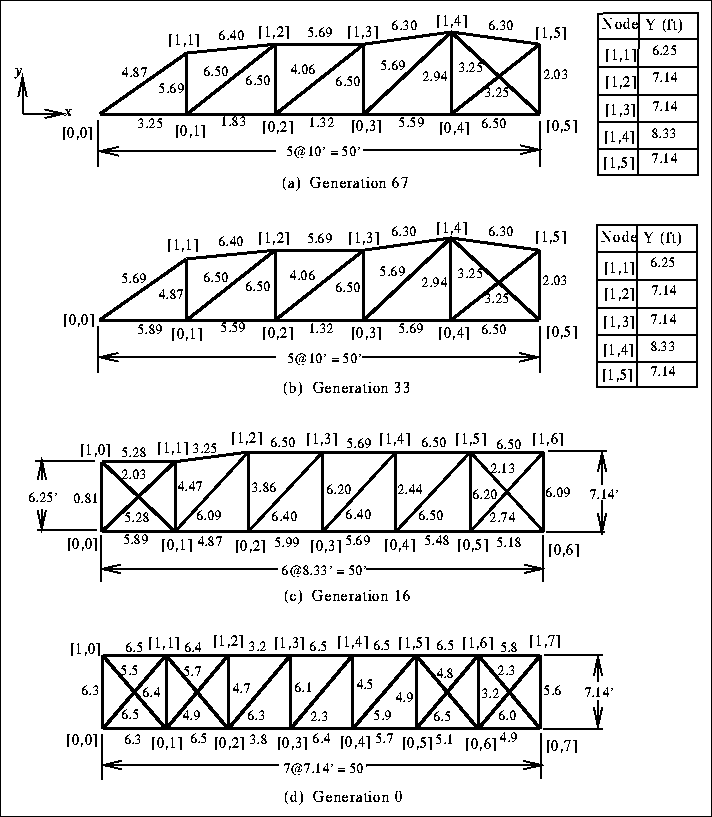
Figure 6: Some solutions produced by a genetic algorithm run
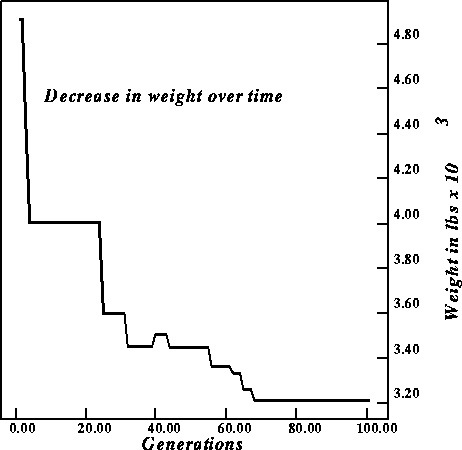
Figure 7: Convergence behavior, best truss weighed 3214 pounds.
[Table 1 here]
In the table, column two gives the maximum depth of each truss while
column three provides panel size and column four the total weight. Column five
to seven report maximum, minimum, and average utility factors, which
are defined as the ratios of the actual stress to the allowable stress in truss
members. The last column displays the maximum displacement. Truss (e)
(generation 0) is not feasible because of the large utility factor,
indicating overstressing in the truss. The design stress requirement used here
allows truss members to be overstressed by ![]() , which means a maximum utility
factor of 1.03. All other trusses are feasible solutions, with utility
factors smaller that 1.03 and the maximum displacement, which occurs at the
rightmost bottom node, smaller than the 5 inches permitted. It
appears that design constraint on stresses plays a much more dominant role than
the deflection constraint does.
, which means a maximum utility
factor of 1.03. All other trusses are feasible solutions, with utility
factors smaller that 1.03 and the maximum displacement, which occurs at the
rightmost bottom node, smaller than the 5 inches permitted. It
appears that design constraint on stresses plays a much more dominant role than
the deflection constraint does.
The results indicate that the evolution of the population has brought changes in their topology, geometry, as well as cross sectional areas. Truss envelopes have evolved from rectangles to curves, which, in general, agree with the shape of the moment diagrams of the trusses (see figure 8). In trusses (a) - (c), the depth is reduced at the center of the trusses (at node [1,5]). We note that if the depth remains 8.33 feet as at node [1,4], the truss will be lighter while all the the design constraints are satisfied. The maximum depth of trusses (a) - (c) range from 7.14 to 8.33 feet, which is approximately 1/14 to 1/13.5 of the span. Since average utility factors reflect the efficiency of material use, another indication of improvement in the population is given by the increase in average utility factors over time.

Figure 8: The shape of moment diagram of trusses (a) - (c)
We would like to point out that genetic algorithms do not guarantee optimal solutions. Different populations sizes or probabilities of crossover can result in the genetic algorithm finding other feasible solutions, some with lower weights. Using Cagan and Mitchell's terminology, genetic algorithms are optimally directed [Cagan and Mitchell, 1993] and can be counted on to improve upon their initial population. Genetic algorithm results point toward good regions of the search space and allow designers to use their knowledge and expertise to improve upon solutions generated through genetic search. For example, if the depth of truss (a) in figure 6 at node [1,5] is changed to 8.33 feet and the two members connecting nodes [0,5], [1,4] and [0,5], [1,5], are removed, the truss weight will be reduced to 3021 pounds. However, the GA has, as expected, quickly reduced the size of the design space and produced some (possibly good) solutions that allow a designer to apply design knowledge and experience to improve them. Letting the genetic algorithm take care of identifying a promising region in the search space for post-processing by an engineer saves time and reduces cost.
Figure 9 shows the best truss configuration weighing 3171 pounds and found in generation 74, for another run of the genetic algorithm. Figure 10 plots its convergence behavior to highlight the fact that the decrease in weight need not be monotonic. The GA is optimizing a function that includes weigth as only one out of three criteria.
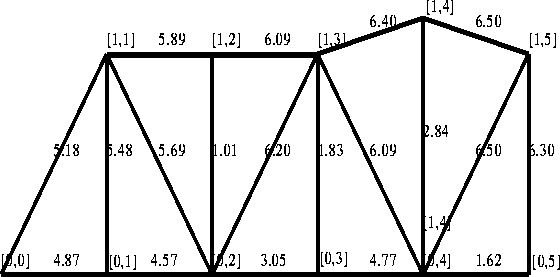
Figure 9: The best truss configuration of another genetic algorithm run, found
in generation 74.
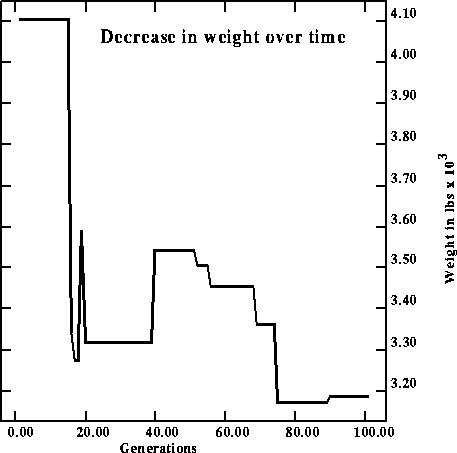
Figure 10: Convergence behavior of genetic algorithm run for the truss in
the previous figure, note the non-monotonic decrease in weight.
As noted earlier, many design heuristics and constraints have been incorporated into the genetic algorithm. These design heuristics and constraints greatly affect both the size of the design solution space and the GA's convergence rate. Relaxing some constraints (reducing the amount of domain knowledge used) can lead to different, and perhaps more surprising, structures. For example, figure 11 shows the best configuration produced in another run where we allow diagonal members to cross two panels.
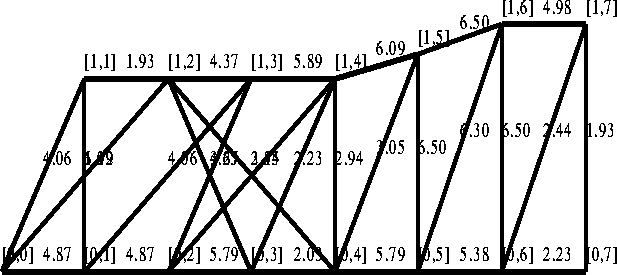
Figure 11: The best truss configuration of a less constrained genetic algorithm
run, found in generation 63. Diagonal member were allowed to cross panels.