The best theory is inspired by practice,
The best practice is guided by theory.- Donald Knuth, IFIP 1992 address.
It is difficult to predict a genetic algorithm's behavior on an arbitrary problem. Combining genetic algorithm theory with practice, this chapter uses the average hamming distance as a syntactic metric to derive bounds on the time convergence of genetic algorithms. Analysis of a flat function provides worst case time complexity for static functions. Further, employing linearly computable runtime information, this thesis provides bounds on the time beyond which progress is unlikely on arbitrary static functions. As a byproduct, the analysis also provides qualitative bounds by predicting average fitness.
Natural selection uses diversity in a population to produce adaptation. Ignoring the effects of mutation for the present, if there is no diversity there is nothing for natural selection to work on. Since GAs mirror natural selection, this chapter applies the same principles and uses a measure of diversity for estimating time to stagnation or convergence. A GA converges when most of the population is identical, or in other words, the diversity is minimal. Using average hamming distance (hamming average) as a measure of population diversity this chapter derives bounds for the time to minimal diversity, when the genetic algorithm may be expected to make no further progress (hamming convergence).
Previous work in GA convergence by Ankenbrandt, and Goldberg and Deb focuses on a lower limit on the time to convergence to a particular allele (Ankenbrandt, 1991; Goldberg and Deb, 1991) using fitness ratios to obtain bounds on time complexity. Since GAs use syntactic information to guide their search, it seems natural to use syntactic metrics in their analysis. The analysis here, using hamming averages, can predict the time beyond which qualitative improvements in the solution are unlikely. Since the schema theorem intimately links schema proportions with fitness, bounds on average fitness follow.
The next section identifies the effect of genetic operators on the diversity metric, which is the hamming average. Deriving an upper bound on the expected time to convergence suggests syntactic remedies to the problem of premature convergence and, as a side effect, how to mitigate deception in GAs. Since crossover does not affect the hamming average, extrapolating the change in the hamming average sampled during the first few generations is used to predict the hamming average in later generations. Results on a test suite of functions indicate that accurate predictions are possible.
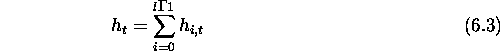
The average hamming distance of a population is the average distance between all pairs of strings in a population of size N. As each member of the population is involved in N-1 pairs, the sample size from which to calculate the average is:
![]()
Let the length of the member strings in the population be l. The hamming
average of the initial population of binary strings is well approximated by the
normal distribution with mean ![]() where
where
![]()
and standard deviation ![]() given by
given by
![]()
Ignoring the effect of mutation, the hamming average of a converged population
is zero (mutation increases the hamming average of a converged population by an
amount ![]() depending on the probability of mutation). Given that
the initial hamming average is l/2 and the final hamming average is zero, the
effects of selection and crossover determine the behavior of a genetic
algorithm in the intervening time.
depending on the probability of mutation). Given that
the initial hamming average is l/2 and the final hamming average is zero, the
effects of selection and crossover determine the behavior of a genetic
algorithm in the intervening time.
Assuming that offspring replace their parents during a crossover, all crossover
operators can be partitioned into two groups based on whether or not they
change the hamming average. If one parent contributes the same alleles to
both offspring (as in masked crossover (chapter ![]() )) the
hamming distance between the children is less than the hamming distance between
their parents. This leads to a loss of genetic material, reducing population
hamming average and resulting in faster hamming convergence. The vast majority
of traditional operators, like one-point, two-point,
)) the
hamming distance between the children is less than the hamming distance between
their parents. This leads to a loss of genetic material, reducing population
hamming average and resulting in faster hamming convergence. The vast majority
of traditional operators, like one-point, two-point, ![]() l-point,
uniform and punctuated crossover [Spears and DeJong, 1991, Schaeffer and Morishima, 1987, Schaeffer and Morishima, 1988, Syswerda, 1989],
do not affect the hamming average of a population. For these crossover
operators the following lemma is proved:
l-point,
uniform and punctuated crossover [Spears and DeJong, 1991, Schaeffer and Morishima, 1987, Schaeffer and Morishima, 1988, Syswerda, 1989],
do not affect the hamming average of a population. For these crossover
operators the following lemma is proved:

Proof: The hamming average in generation t+1 is proved to be the same
as the hamming average at generation t under the action of crossover alone.
Assuming a binary alphabet ![]() , express the population hamming
average at generation t as the sum of hamming averages of l loci, where l
is the length of the chromosome. Letting
, express the population hamming
average at generation t as the sum of hamming averages of l loci, where l
is the length of the chromosome. Letting ![]() stand for the hamming
average of the
stand for the hamming
average of the ![]() locus results in:
locus results in:
![]()
where ![]() is
is
![]()
In the absence of selection and mutation, crossover only changes the order in which to sum the contributions at each locus. That is:
![]()
The hamming average in the next generation is therefore
![]()
Q.E.D
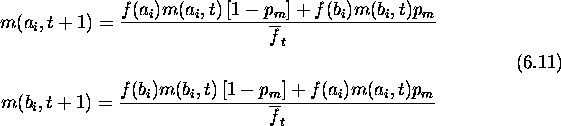
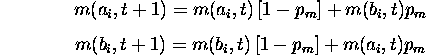
Having eliminated crossover from consideration since it causes no change in the hamming average, it remains for selection to provide the force responsible for hamming convergence.
Unlike recombination, selection intensity depends on the properties of the search space. It is the domain-dependent or problem-dependent part of a genetic algorithm. But, independent of the domain, it is possible to obtain an upper bound on the time to convergence. Obtaining an upper bound is equivalent to assuming the worst possible search space and estimating the time required for finding a point in this space. For a static function, a space on which an algorithm can do no better than random search satisfies this criterion. The flat function defined by
![]()
contains no useful information for an algorithm searching for a particular point in the space. Thus no algorithm can do better than random search on this function. In terms of selection in genetic algorithms, the flat function assigns an equal fitness to all members of a population. There is no selection pressure to lead to a decrease in hamming average since the probability of selection is now the same for every individual. However, a simple GA without mutation loses diversity and eventually converges. An expression for the time convergence on such a function gives an upper bound on the time complexity of a genetic algorithm on any static function. The GA's convergence on the flat function is caused by random genetic drift where small random variations in allele distribution cause a GA to drift and eventually converge. The time for a particular allele to become fixed due to random genetic drift is used to derive an upper bound.
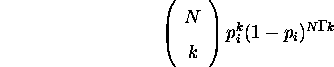
If a population of size N contains a proportion ![]() of a binary allele i,
then the probability that k copies of allele i are produced in the
following generation is given by the binomial probability distribution
of a binary allele i,
then the probability that k copies of allele i are produced in the
following generation is given by the binomial probability distribution
This distribution is useful in calculating the probability of a particular
frequency of occurrence of allele i in subsequent generations -- A classical
problem in population genetics. Although the exact solution is complex,
approximating the probability that allele frequency takes value p in
generation t is practical. Wright's approximation for intermediate allele
frequencies and population sizes, as given in [Gale, 1990], is
sufficient. Let ![]() stand for the probability that allele frequency
takes value p in generation t where
stand for the probability that allele frequency
takes value p in generation t where ![]() then
then
![]()
The probability that an allele is fixed at generation t is
![]()
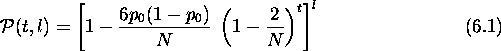
Applying this to a genetic algorithm, assuming a randomly instantiated population at t = 0 ,
![]()
Assuming that alleles consort independently, which is true for a flat function, the expression for the probability that all alleles are fixed at generation t for a chromosome of length l alleles, is given by
Equation ![]() gives the time to convergence for a genetic algorithm on
a flat function and is therefore an upper bound for any static function. For
example, on a 50 bit chromosome and a population size of 30, this gives an
upper bound of
gives the time to convergence for a genetic algorithm on
a flat function and is therefore an upper bound for any static function. For
example, on a 50 bit chromosome and a population size of 30, this gives an
upper bound of ![]() on the chance of convergence in 50 generations.
Experimental results get between
on the chance of convergence in 50 generations.
Experimental results get between ![]() and
and ![]() convergence starting with an
initial hamming average of 50/2 = 25. Previous work by Goldberg and Segrest
on genetic drift gives a more exact albeit more computationally taxing
expression for time to convergence due to genetic
drift [Goldberg and Segrest, 1987]. They also include the effect of mutation in
their analysis, which once again is directly applicable to our problem. In
fact, since the flat function costs one assignment statement and genetic
operators are computationally inexpensive, running a genetic algorithm on a
flat function with mutation and crossover probabilities set to practical values
can cheaply produce an upper bound.
convergence starting with an
initial hamming average of 50/2 = 25. Previous work by Goldberg and Segrest
on genetic drift gives a more exact albeit more computationally taxing
expression for time to convergence due to genetic
drift [Goldberg and Segrest, 1987]. They also include the effect of mutation in
their analysis, which once again is directly applicable to our problem. In
fact, since the flat function costs one assignment statement and genetic
operators are computationally inexpensive, running a genetic algorithm on a
flat function with mutation and crossover probabilities set to practical values
can cheaply produce an upper bound.
Finally, that GAs converge due to random drift gives a theoretical basis to the often observed problem of premature convergence, when the genetic algorithm converges before high fitness schemas have sufficient time to recombine into the global optimum [Thierens and Goldberg, 1993]. The next section suggests one method of alleviating this problem.
Nature uses large population sizes to ``solve'' the premature convergence problem. This is expensive, furthermore engineers need not be restricted to nature's methods but can do some genetic engineering. Mutation seems a likely candidate, and in practice, is the usual way of maintaining diversity. However, although high mutation rates may increase diversity, its random nature raises problems. Mutation is as likely to destroy good schemas as bad ones and therefore elitist selection is used to preserve the best individuals in a population. This works quite well in practice, but is unstructured and cannot insure that all alleles are always present in the population.
Instead of increasing mutation rates, picking an individual and adding its bit complement to the population ensures that every allele is present and the population spans the entire encoded space of the problem. The individual to be complemented can be picked in a variety of ways depending on assumptions made about the search space. Randomly selecting the individual to be complemented makes the least number of assumptions and may be the best strategy in the absence of other information. The best or worst individual could also be selected, or probabilistic methods can be used in choosing whom to complement. Instead of complementing one individual, choosing a set of individuals allows spanning the encoded space in many directions. The most general approach is to maintain the complement of every individual in the population, doubling the population size.
The presence of complementary individuals also makes a GA more resistant to
deception. Intuitively, since the optimal schema is the complement of the
deceptively optimal schema, it will be repeatedly created with high probability
as the GA converges to the deceptive optimum [Goldberg et al., 1989]. In experiments
the minimum fitness individual was replaced with either the complement of a
randomly picked individual in the current population, or the complement of the
current best individual. Let ![]() represent the number of bits needed to
represent variable i in a deceptive problem, then the deceptive functions
used can be described as follows
represent the number of bits needed to
represent variable i in a deceptive problem, then the deceptive functions
used can be described as follows
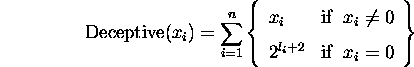
Dec1 and Dec2 which are 10-bit and 20-bit deceptive problems respectively were used. Letting superscripts denote the number of bits needed for each variable, Dec1 can be described by
![]()
and Dec2 by
![]()
Figure ![]() compares the average fitness after 100 generations of a
classical GA (CGA) and a GA with complements (GAC) on a Dec1.
compares the average fitness after 100 generations of a
classical GA (CGA) and a GA with complements (GAC) on a Dec1.
Figure: Average fitness over 100 generations of classical GA
and GA with complements. GAC (max) replaces the worst individual with the
complement of the current best individual. GAC (random) replaces the worst
individual with the complement of a random individual in the population
The GAC easily outperforms the classical GA, both in average fitness and the
number of times the optimum was found. In most experiments the classical GA
fails to find the optimum in 11 runs of the GA with a population size of 30
in a 100 generations. Since the converged hamming average for the CGA is very
small, it is not expected to be ever able to find the global optimum. GAC on
the other hand easily finds the optimum for Dec1 within a 100 generations and
usually finds the optimum for Dec2 within a few hundred generations.
Figures ![]() and
and ![]() show the number of times the optimum was
found for Dec1 and Dec2 within a total of 100 and 1000 generations
respectively. In the figures GAC (max) replaces the worst individual with the
complement of the current best individual. GAC (random) replaces the worst
individual with the complement of a random individual in the population.
show the number of times the optimum was
found for Dec1 and Dec2 within a total of 100 and 1000 generations
respectively. In the figures GAC (max) replaces the worst individual with the
complement of the current best individual. GAC (random) replaces the worst
individual with the complement of a random individual in the population.
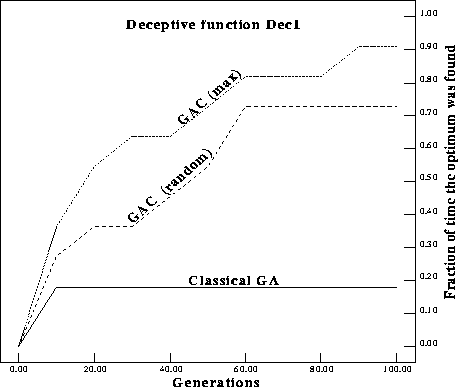
Figure: Number of times the optimum was found on Dec1 for a classical GA
compared with the same statistic for GAs with complements (GACs).
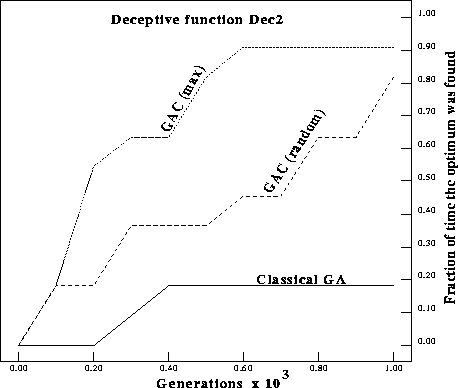
Figure: Number of times the optimum was found on Dec2 for a classical GA
compared with GAs with complements (GACs).
Although this genetically engineered algorithm can mitigate certain kinds of deception, it is not a panacea and cannot guarantee an optimal solution on all problems. Messy Genetic Algorithms [Goldberg et al., 1989] can make much stronger guarantees but their computational complexity is daunting. Not surprisingly, GAC also does better than a classical GA on Ackley's One Max and no worse on the De Jong test suite [Ackley, 1987, DeJong, 1975]. In problems consisting of mixed deceptive and easy subproblems the GAC still does much better than the classical GA
Predicting performance on an arbitrary function is more difficult than obtaining an upper bound because of the non-linearities introduced by the selection intensity. However tracking the decrease in hamming average while a GA is working on a particular problem allows predicting the time to hamming convergence.
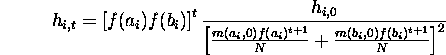
Without mutation a GA reduces the hamming average from l/2 to zero. Therefore predicting the time to convergence reduces to the problem of finding the rate of decrease in hamming average. A general model for the change in hamming average per generation:
relates the hamming average ![]() in generation t to the hamming average
in the next generation. Finding
in generation t to the hamming average
in the next generation. Finding ![]() and solving the recurrence is enough
to predict the time to convergence.
and solving the recurrence is enough
to predict the time to convergence.
The population hamming average at generation t can be expressed as the sum of
hamming averages of l loci, where l is the length of the chromosome.
Letting ![]() stand for the hamming average of the
stand for the hamming average of the ![]() locus gives:
locus gives:
Assuming a binary alphabet ![]() , and a large population, the hamming
average of a locus in the current population is well approximated by the
product of the number of a's and the number of b's divided by the sample
size N(N-1)/2, where N is the population size. More formally, letting
, and a large population, the hamming
average of a locus in the current population is well approximated by the
product of the number of a's and the number of b's divided by the sample
size N(N-1)/2, where N is the population size. More formally, letting
![]() and
and ![]() be the number of a's and b's at a locus i,
be the number of a's and b's at a locus i,
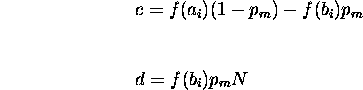
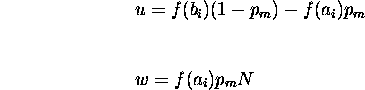
Since a and b are first-order schemas competing at locus i, their growth rates are given by the schema theorem. The expected growth rate for a schema s with fitness f(s) due to selection alone is
Here ![]() is the population's average fitness in generation t.
As only first-order schema are being considered, there is no modification
needed to incorporate crossover's effects. Ignoring mutation for the present,
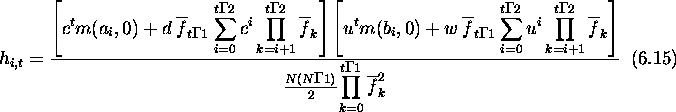
the hamming average in generation t+1 at locus i can be calculated as
follows. First:
is the population's average fitness in generation t.
As only first-order schema are being considered, there is no modification
needed to incorporate crossover's effects. Ignoring mutation for the present,
the hamming average in generation t+1 at locus i can be calculated as
follows. First:
![]()
Then using the schema theorem ![]() can be expressed in terms of
can be expressed in terms of
![]() ,
,
![]()
Substituting using equation ![]() :
:
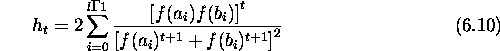
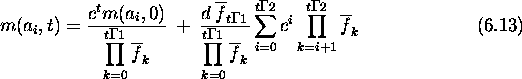
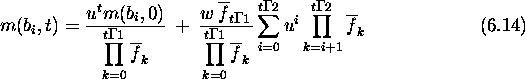
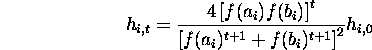
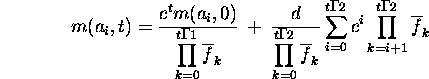
The solution to this recurrence is
The denominator needs to be computed. This is an interesting problem not only because it helps in predicting the hamming average, but because it implies the possibility of fitness prediction. Once again concentrating on first-order schemas, consider the average fitness in generation t at locus i.
![]()
But ![]() also approximates the population average fitness in
low epistasis problems. The approximation gets better as epistasis decreases
and our estimates of first-order schema fitnesses get better.
Keeping this assumption in mind and dropping the first subscript
also approximates the population average fitness in
low epistasis problems. The approximation gets better as epistasis decreases
and our estimates of first-order schema fitnesses get better.
Keeping this assumption in mind and dropping the first subscript
Using the schema theorem (equation ![]() ) to replace the
t terms on the right hand side
) to replace the
t terms on the right hand side
![]()
Multiplying both sides by ![]()
![]()
But by the schema theorem (equation ![]() )
)
![]()
Therefore
![]()
Multiplying by ![]()
![]()
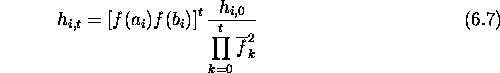
In general,
which is the needed expression. This equation's significance in fitness
prediction is discussed in the next section. For the present, substituting
equation ![]() in
in ![]() gives
gives ![]() in terms
of the initial hamming average.
in terms
of the initial hamming average.
For a randomly initialized population
![]()
Therefore
![]()
Rearranging terms
Here ![]() is the initial hamming average at locus i. For a randomly
initialized population, the hamming average for each locus is 1/2.
Replacing
is the initial hamming average at locus i. For a randomly
initialized population, the hamming average for each locus is 1/2.
Replacing ![]() by 1/2
by 1/2
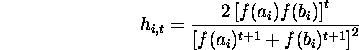
Summing over i from 0 to l - 1 gives the population hamming average in
generation t
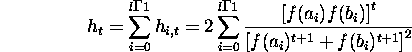
the expression for the hamming average in generation t, depends only on the fitnesses of alleles in the chromosome.
With mutation the hamming average does not converge to zero, rather a
population converges when the rate of change of hamming average is very
low or zero. Consider mutation's effect on the number of a's and b's.
Mutation flips a bit with probability ![]() , changing the number of copies of
a and b in subsequent generations. Without selection
, changing the number of copies of
a and b in subsequent generations. Without selection
since the a's become b's and vice-versa. Incorporating selection
The equation for hamming distance in generation t is
To solve this ![]() is needed in terms of
is needed in terms of ![]() . Substituting
. Substituting
![]() in equation
in equation ![]()
![]()
Collecting terms
![]()
This is of the form
![]()
where
The solution to this recurrence is
Before calculating the product of fitnesses, rewrite the second term as
Similarly letting
results in
Substituting these values into equation ![]() directly
directly
Unlike the case without mutation, it is difficult to find a simple
expression for the product of fitness averages. In addition, the calculations
implied by equation ![]() are cumbersome. For practical prediction this
chapter resorts to an approximate model.
are cumbersome. For practical prediction this
chapter resorts to an approximate model.
The intuition needed to address the problem is that the schema theorem works
both ways. If schema fitnesses are known, proportions can be predicted -- if
proportions are tracked, fitnesses can be predicted. Rewriting
equation ![]() as
as
![]()
Keeping track of ![]() over a few generations should give an estimated
fitness for
over a few generations should give an estimated
fitness for ![]() . Mutation can be handled in the same way starting with
equation
. Mutation can be handled in the same way starting with
equation ![]() .
.
Solving for ![]() using the second expression
using the second expression
![]()
Substituting back in the first expression in equation ![]() and solving
for
and solving
for ![]()
![]()
which leads to
![]()
multiplying by ![]()
![]()
from which the expression for ![]() can be computed
can be computed
and subsequently an expression for ![]()
The two equations ![]() and
and ![]() above can be used to estimate first
order schema fitnesses by tracking their proportions over time. Using these
estimates in the expression for average fitness
above can be used to estimate first
order schema fitnesses by tracking their proportions over time. Using these
estimates in the expression for average fitness ![]() in
generation t gives
in
generation t gives
where N is the population size. This results in being able to predict fitness
averages. In other words, tracking first-order schema proportions allows
estimation of their fitness. Next, using these first-order schema fitnesses
allows predicting their future proportions from the schema theorem
(equation ![]() ). Finally, knowing first-order schema fitnesses and
proportions allows predicting the subsequent population average fitness, which
is needed for estimating future proportions and so on. Although a closed-form
solution is not available for the case with mutation, the recurrences can be
programmed and run on a computer for a large number of generations.
). Finally, knowing first-order schema fitnesses and
proportions allows predicting the subsequent population average fitness, which
is needed for estimating future proportions and so on. Although a closed-form
solution is not available for the case with mutation, the recurrences can be
programmed and run on a computer for a large number of generations.
Assuming that string similarity implies fitness similarity, the variance of fitness is a measure of the nonlinearities in the genome and hence a measure of epistasis. Fortunately, competing schemas with a large fitness variance feel high selection pressure and quickly lose diversity, diminishing epistatic effects. Since a GA exponentially reduces high variances, O(logN) generations should suffice to reduce most nonlinear effects.
The following methodology is therefore used for practical prediction:
Using an adjusted fitness computed this way, it is possible to predict the growth rate of first-order schema and therefore the population average fitness and population hamming average in subsequent generations.
Consider the effect of newly discovered schemas on the predictions. Fresh schemas that decrease adjusted fitnesses have little effect since they are quickly eliminated by selection. When higher fitness schemas are discovered by crossover, the fitness of alleles participating in these schemas increases. This means that the predicted hamming average will be greater than or equal to the observed value giving an upper limit on the time to convergence. The predictions therefore provide upper bounds on the hamming average and time to convergence to that hamming average. Such an estimate is more desirable than an overly optimistic estimate: It is better to let a GA run too long than to stop it early.
The variance in adjusted fitness for an allele bounds the number of generations sampled to get an accurate estimate of the allele's fitness. This variance bounds the current fitness of schemas in which the allele participates. At a particular locus, using the allele with the least variance to predict growth gives a conservative estimate of hamming average. Low variance implies a good approximation to the current fitness of the allele and provides an upper bound on our predicted hamming average. Similarly, using the allele with greater variance gives an optimistic estimate or lower bound. These bounds should surround the predicted value of the hamming average. Results given in the following sections support this preliminary analysis.
Noisy functions and noise induced by mutation may cause less desirable, more unpredictable behavior. This problem can be solved by having a larger sample space, that is, using more generations to calculate adjusted fitnesses.
For much the same reasons above, calculating adjusted fitnesses allows predicting a lower limit on the fitness average because these fitnesses only incorporate the effects of current schemas. Any new schemas (created by crossover) that increase the adjusted fitness of an allele can lead to a higher than predicted fitness average. In multimodal functions, the opposite may happen. The GA could initially concentrate around one optimum and then move toward another optimum. Since the calculated adjusted fitnesses may no longer be correct and it takes a GA time to overcome the inertia created by the first optimum, the predicted fitness average may be higher than the actual fitness average.
Since hamming average prediction is quite robust and a first-order
approximation may be interesting enough, a linear approximation of ![]() in
equation
in
equation ![]() can be tried out for prediction. Assuming a quick and simple
model for the case without mutation
can be tried out for prediction. Assuming a quick and simple
model for the case without mutation
![]()
whose general solution is given by
This chapter compares this simple equation's predictions with the predictions
generated using the analysis in section ![]() . The task is to predict
the hamming average at generation 50 for the following functions:
. The task is to predict
the hamming average at generation 50 for the following functions:
All problems were reduced to maximization problems. The GA population size in
all experiments was 30, using proportional selection and two-point
crossover. a in equation ![]() was computed from successive hamming
averages in generations 0 through 10. Table
was computed from successive hamming
averages in generations 0 through 10. Table ![]() summarizes the
results. The last two columns predict lower and upper bounds from the analysis
in section
summarizes the
results. The last two columns predict lower and upper bounds from the analysis
in section ![]() (equations
(equations ![]() ,
, ![]() , and
, and ![]() ),
using proportions sampled in generations
),
using proportions sampled in generations ![]() through
9 only. Since the encoding for the DeJong functions used a sign bit, 5
samples were optimistically chosen as sufficient. The experimental values are
averages over 11 runs with no mutation. The standard deviations over 11
runs of the GA are given in parentheses.
through
9 only. Since the encoding for the DeJong functions used a sign bit, 5
samples were optimistically chosen as sufficient. The experimental values are
averages over 11 runs with no mutation. The standard deviations over 11
runs of the GA are given in parentheses.
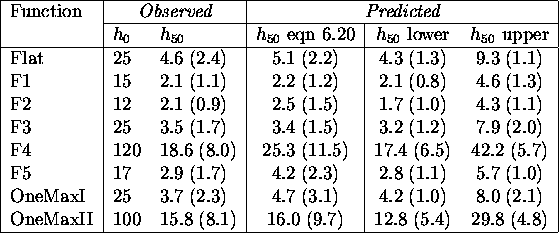
Table: Comparing actual and predicted hamming averages (no
mutation)
Surprisingly, the values predicted using the rough approximation are quite good and are within a standard deviation of the observed values. That good results come from even such a simple model clearly indicates the validity of this approach. Predicted upper and lower bounds on the upper limit include the observed values except for OneMaxI whose lower bound is greater than the observed hamming average. This implies a large variance in sampled allelic fitnesses. Intuitively, the observed fitness of an allele depends on the number of ones in the entire chromosome, leading to the observed conservative estimate in the absence of mutational noise. OneMax should be expected to create greater problems when including mutation.
Next, realizing that mutation makes the final hamming average greater than 0, another related simplified model is used to predict hamming average at convergence for the same set of problems but with the mutation rate set to 0.01. The model is given below.
The general solution is
![]()
In these experiments the GA ran until hamming convergence when the hamming
average did not change significantly over time. Experimentally, 500
generations was sufficient for the problem set. Calculating the values of a
and b in equation ![]() using the method of least squares, the
hamming average is predicted at convergence (generation 500). This is found
by setting
using the method of least squares, the
hamming average is predicted at convergence (generation 500). This is found
by setting ![]() and solving for
and solving for ![]() , resulting in
, resulting in
![]()
Table ![]() compares the observed hamming average at generation 500
with the predicted values. Column three tabulates the hamming average at
convergence and its standard deviation over the 11 runs. Columns four and
five are the predicted hamming averages using equation
compares the observed hamming average at generation 500
with the predicted values. Column three tabulates the hamming average at
convergence and its standard deviation over the 11 runs. Columns four and
five are the predicted hamming averages using equation ![]() and data
from generations 5 through 20 and 5 through 45 respectively. The
simpler model (curve fitting) does much worse when mutation is incorporated. It
requires more samples, and even predicts negative hamming averages at
convergence. However, the more refined model developed in this chapter
predictably needs no extra information and therefore still uses samples from
generations 5 through 9 to produce the last two columns.
and data
from generations 5 through 20 and 5 through 45 respectively. The
simpler model (curve fitting) does much worse when mutation is incorporated. It
requires more samples, and even predicts negative hamming averages at
convergence. However, the more refined model developed in this chapter
predictably needs no extra information and therefore still uses samples from
generations 5 through 9 to produce the last two columns.
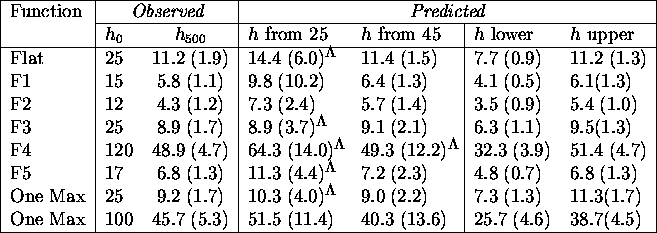
Table: Comparing actual and predicted hamming averages with
the probability of mutation set to 0.01, the *'s indicate that the
negative values predicted in some runs were discarded.
The predictions of the model developed in this chapter, displayed in
table ![]() , are very close to the observed values. Although the hamming
average after 500 generation is large for F4 and OneMaxII, there is no
significant change even after 2000 generations. This just indicates that
once a GA reaches the equilibrium hamming average, some other search method
should be tried especially if the converged hamming average is large. Predicted
upper and lower bounds are still good except for OneMaxII. Here, noise induced
by mutation is the major culprit. The high variance in allele fitnesses
suggests using a larger sample space to increase the signal to noise ratio.
Sure enough, using an additional 15 generations to sample fitnesses suffices
to correct the problem and give good bounds on OneMaxII.
, are very close to the observed values. Although the hamming
average after 500 generation is large for F4 and OneMaxII, there is no
significant change even after 2000 generations. This just indicates that
once a GA reaches the equilibrium hamming average, some other search method
should be tried especially if the converged hamming average is large. Predicted
upper and lower bounds are still good except for OneMaxII. Here, noise induced
by mutation is the major culprit. The high variance in allele fitnesses
suggests using a larger sample space to increase the signal to noise ratio.
Sure enough, using an additional 15 generations to sample fitnesses suffices
to correct the problem and give good bounds on OneMaxII.
Since a simplified curve fitting model gave good results on hamming average
prediction, equation ![]() was used for fitness prediction as well.
Table
was used for fitness prediction as well.
Table ![]() predicts the average fitness (F) at convergence without
mutation. Column two gives the initial average fitness and column three the
converged average fitness in generation 50. The standard deviations of the
observed and predicted average fitnesses over the 11 runs are in parentheses.
The next two columns are the predicted fitness averages using
equation
predicts the average fitness (F) at convergence without
mutation. Column two gives the initial average fitness and column three the
converged average fitness in generation 50. The standard deviations of the
observed and predicted average fitnesses over the 11 runs are in parentheses.
The next two columns are the predicted fitness averages using
equation ![]() from fitnesses sampled in generations 5 through 15
and 5 through 25 respectively. The last two columns use equation
from fitnesses sampled in generations 5 through 15
and 5 through 25 respectively. The last two columns use equation ![]() to provide conservative and optimistic bounds on the average fitness. As stated
earlier, both bounds are expected to underestimate the observed fitness, unless
the function is multimodal or has high fitness variance. Since the average
fitness is a byproduct of hamming average prediction, the hamming average data
from generations 5 through 10 is used for fitness prediction. The
flat function is not considered.
to provide conservative and optimistic bounds on the average fitness. As stated
earlier, both bounds are expected to underestimate the observed fitness, unless
the function is multimodal or has high fitness variance. Since the average
fitness is a byproduct of hamming average prediction, the hamming average data
from generations 5 through 10 is used for fitness prediction. The
flat function is not considered.
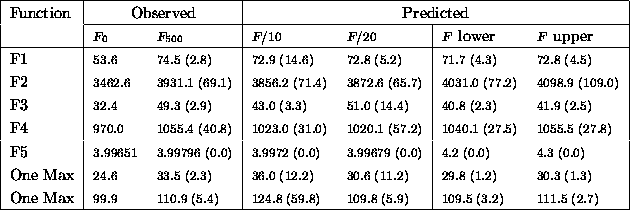
Table: Comparing actual and predicted fitness averages (no
mutation)
The simple linear model's predictions of average fitness are are also within about one standard deviation of observed values. It is more interesting to look at the upper and lower bounds. As expected F2 and F5 which are multimodal, have higher predicted fitnesses. Other predictions serve as conservative and optimistic lower bounds.
Table ![]() summarizes results on the same set of problems with mutation
probability set to 0.01. Mutation's effect forces good predictions to use
even larger data samples for the simpler linear model. The upper and lower
bounds again fall out of the hamming average data for generations 5 through
9 with mutation.
summarizes results on the same set of problems with mutation
probability set to 0.01. Mutation's effect forces good predictions to use
even larger data samples for the simpler linear model. The upper and lower
bounds again fall out of the hamming average data for generations 5 through
9 with mutation.
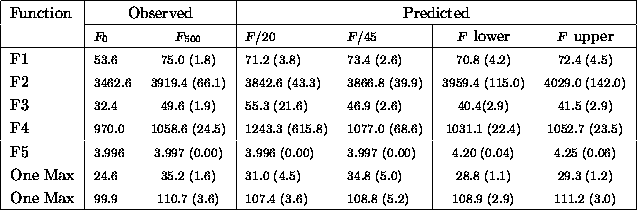
Table: Comparing actual and predicted fitness averages with the
probability of mutation set to 0.01
These preliminary results support this chapter's model of genetic algorithm
behavior. Although curve fitting has its uses in providing a very rough
approximation, it cannot predict the effects of changes in GA parameters and
does badly in the presence of mutation. Using the analysis in
section ![]() it is easy to predict the time to convergence on a
problem. This is just the time at which the change in hamming average is
insignificant. Knowing available computing resources fixes the hamming average
below which exhaustive search of the remaining space can be undertaken, and
therefore the time needed to deliver on an application.
In practice, instrumenting a GA to keep estimates of allele fitness and
proportions should reduce the time spent experimenting with various parameter
settings and let the developer know the computing resources needed. If the
problem encoding is highly epistatic or otherwise undesirable from a prediction
point of view, just keeping track of the hamming average and rate of change of
hamming average indicates the progress of a genetic algorithm on the problem.
In addition, incorrect predictions from the theory indicate that the problem
encoding exhibits these undesirable properties. This is useful information
about the problem space and can be used in changing the GAs parameters or the
problem's encoding.
it is easy to predict the time to convergence on a
problem. This is just the time at which the change in hamming average is
insignificant. Knowing available computing resources fixes the hamming average
below which exhaustive search of the remaining space can be undertaken, and
therefore the time needed to deliver on an application.
In practice, instrumenting a GA to keep estimates of allele fitness and
proportions should reduce the time spent experimenting with various parameter
settings and let the developer know the computing resources needed. If the
problem encoding is highly epistatic or otherwise undesirable from a prediction
point of view, just keeping track of the hamming average and rate of change of
hamming average indicates the progress of a genetic algorithm on the problem.
In addition, incorrect predictions from the theory indicate that the problem
encoding exhibits these undesirable properties. This is useful information
about the problem space and can be used in changing the GAs parameters or the
problem's encoding.
Analyzing a GA is complicated because of its dependence on the application domain and our lack of understanding of the mapping between our view of the application domain and the GA's view of the same domain. The GA's view of the domain is implicit in the chosen encoding. However, the overall behavior is predictable and can be deduced from sampling suitable metrics.
Analysis of the syntactic information in the encoding gives a surprising amount of knowledge. This chapter derived an upper bound on the time complexity from considering the effects of drift on allele frequency. Then, from a model of the effect of selection and mutation on the behavior of genetic algorithms, the analysis was able to approximate two solution characteristics at convergence for static search spaces.
This dissertation has helped develop the foundations for the use of genetic algorithms as a computational tool for design. The last chapter summarizes these developments, discusses their limitations and makes explicit the questions arising from the research.